hoffstadt / hoffstadt/DearPyGui
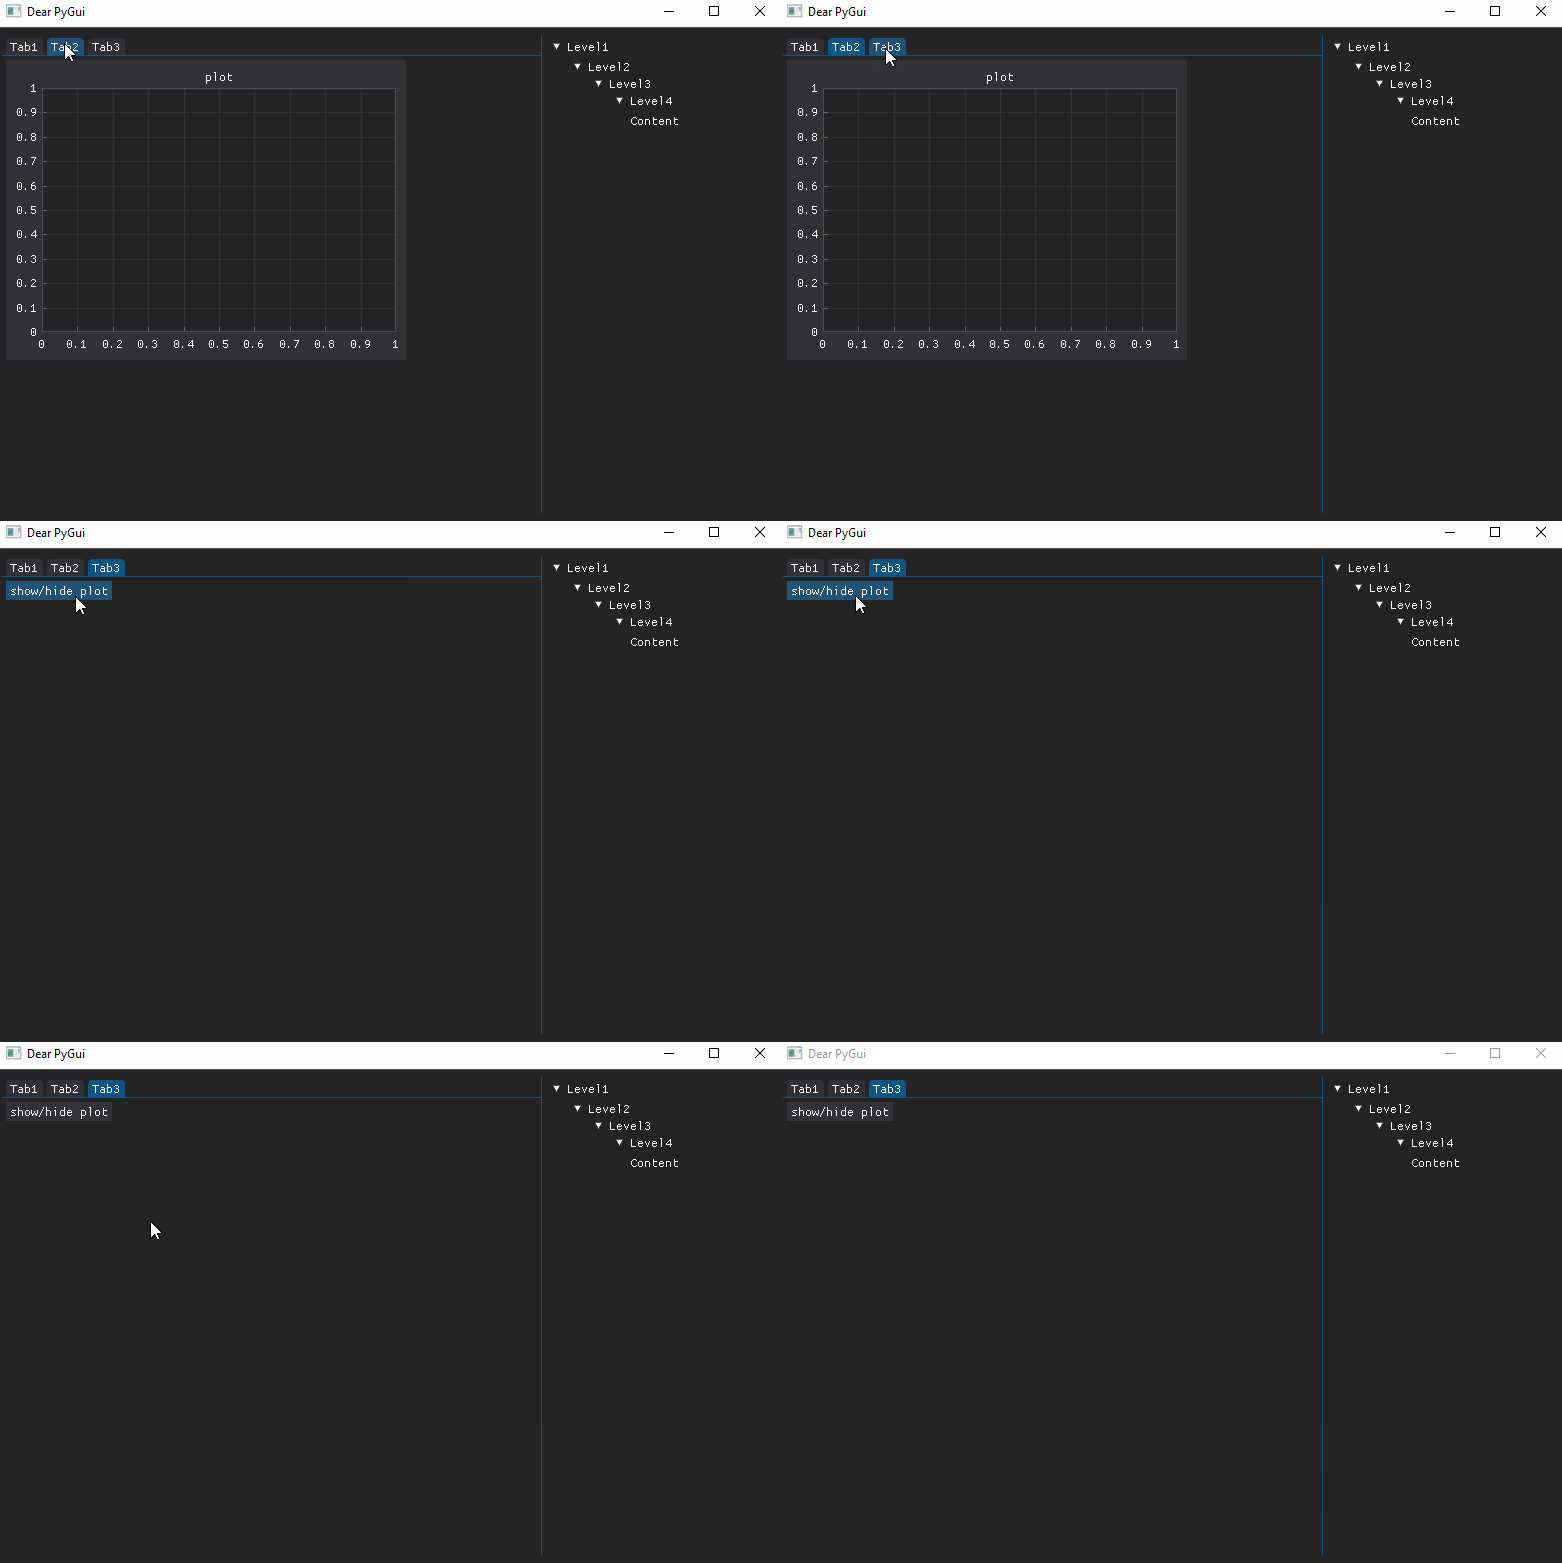
Showing/hiding of a plot in one cell of a table modifies layout in other cell
- Dominant language
- C++
- Stars
- 15.6k
- Forks
- 783
- PR merge metrics
- No merged PRs in 30d
Description
## Version of Dear PyGui
Version: 1.6.2
Operating System: Windows 10
## My Issue/Question
The issue is pretty much described in the title and shown in the video. Note that such behavior was observed when in the **last tab**. Just adding an empty tab to the end is enough to "fix" this issue. Just add
```python
with dpg.tab(label="Tab4"):
pass
```
after the `Tab3` and the weird behavior will disappear. However, I do not want to add dummy tabs to keep my layout consistent.
## To Reproduce
Steps to reproduce the behavior:
1. Go to `Tab3`
2. Click repeatedly on `show/hide plot`
3. See changes in the position of the `tree_node`s
## Expected behavior
Visibility of a plot in one cell should not affect layout of the `tree_node`s in other cell.
## Screenshots/Video
## Standalone, minimal, complete and verifiable example
```python
import dearpygui.dearpygui as dpg
dpg.create_context()
dpg.create_viewport()
dpg.setup_dearpygui()
with dpg.theme(default_theme=True) as thm:
with dpg.theme_component(dpg.mvTable):
dpg.add_theme_color(dpg.mvThemeCol_TableBorderLight, (15, 86, 135, 255))
with dpg.window(tag="primary"):
dpg.bind_theme(thm)
with dpg.table(
width=-1, height=-1, header_row=False,
policy=dpg.mvTable_SizingStretchProp, delay_search=True, hideable=True,
borders_innerV=True
):
dpg.add_table_column(init_width_or_weight=0.7)
dpg.add_table_column(init_width_or_weight=0.3)
with dpg.table_row():
with dpg.tab_bar():
with dpg.tab(label="Tab1"):
with dpg.plot(label="plot"):
pass
with dpg.tab(label="Tab2"):
with dpg.plot(label="plot"):
pass
with dpg.tab(label="Tab3"):
dpg.add_button(label="show/hide plot", callback=lambda: dpg.configure_item("last_plot", show=not dpg.is_item_visible("last_plot")))
dpg.add_plot(label="plot", show=False, tag="last_plot")
with dpg.tree_node(label="Level1", default_open=True):
with dpg.tree_node(label="Level2", default_open=True):
with dpg.tree_node(label="Level3", default_open=True):
with dpg.tree_node(label="Level4", default_open=True):
dpg.add_text("Content")
dpg.show_viewport()
dpg.set_primary_window("primary", True)
dpg.start_dearpygui()
dpg.destroy_context()
```
Contributor guide
Assessment
This issue has not been assessed yet.