hoffstadt / hoffstadt/DearPyGui
Plot time serides data with skip weekends and time in between.
- Dominant language
- C++
- Stars
- 15.6k
- Forks
- 783
- PR merge metrics
- No merged PRs in 30d
Description
**Is your feature request related to a problem? Please describe.**
So i want to plot a data of with time on xaixs, and some float value on y-axis. The plot is drawn using add_line_series (date_time_1min, close_prices,label="Data", parent=self.yaxis, id="series_id").
The problem is my data is only availvable between 9:30 AM to 4:30 PM and weekdays. When i plot the data using above function it interpolates the dates and times in between also, which make an ugly plot in the end.
**Describe the solution you'd like**
A clear and concise description of what you want to happen.
May be something like these guys have done for matplot lib
https://stackoverflow.com/questions/1273472/how-to-skip-empty-dates-weekends-in-a-financial-matplotlib-python-graph
**Describe alternatives you've considered**
**Additional context**
Add any other context or screenshots about the feature request here.
Not Wanted Plot using current provide functions

(This is what i would like to see the data if the weekends and time between 4:30 PM to 9:30 AM is skipped.)
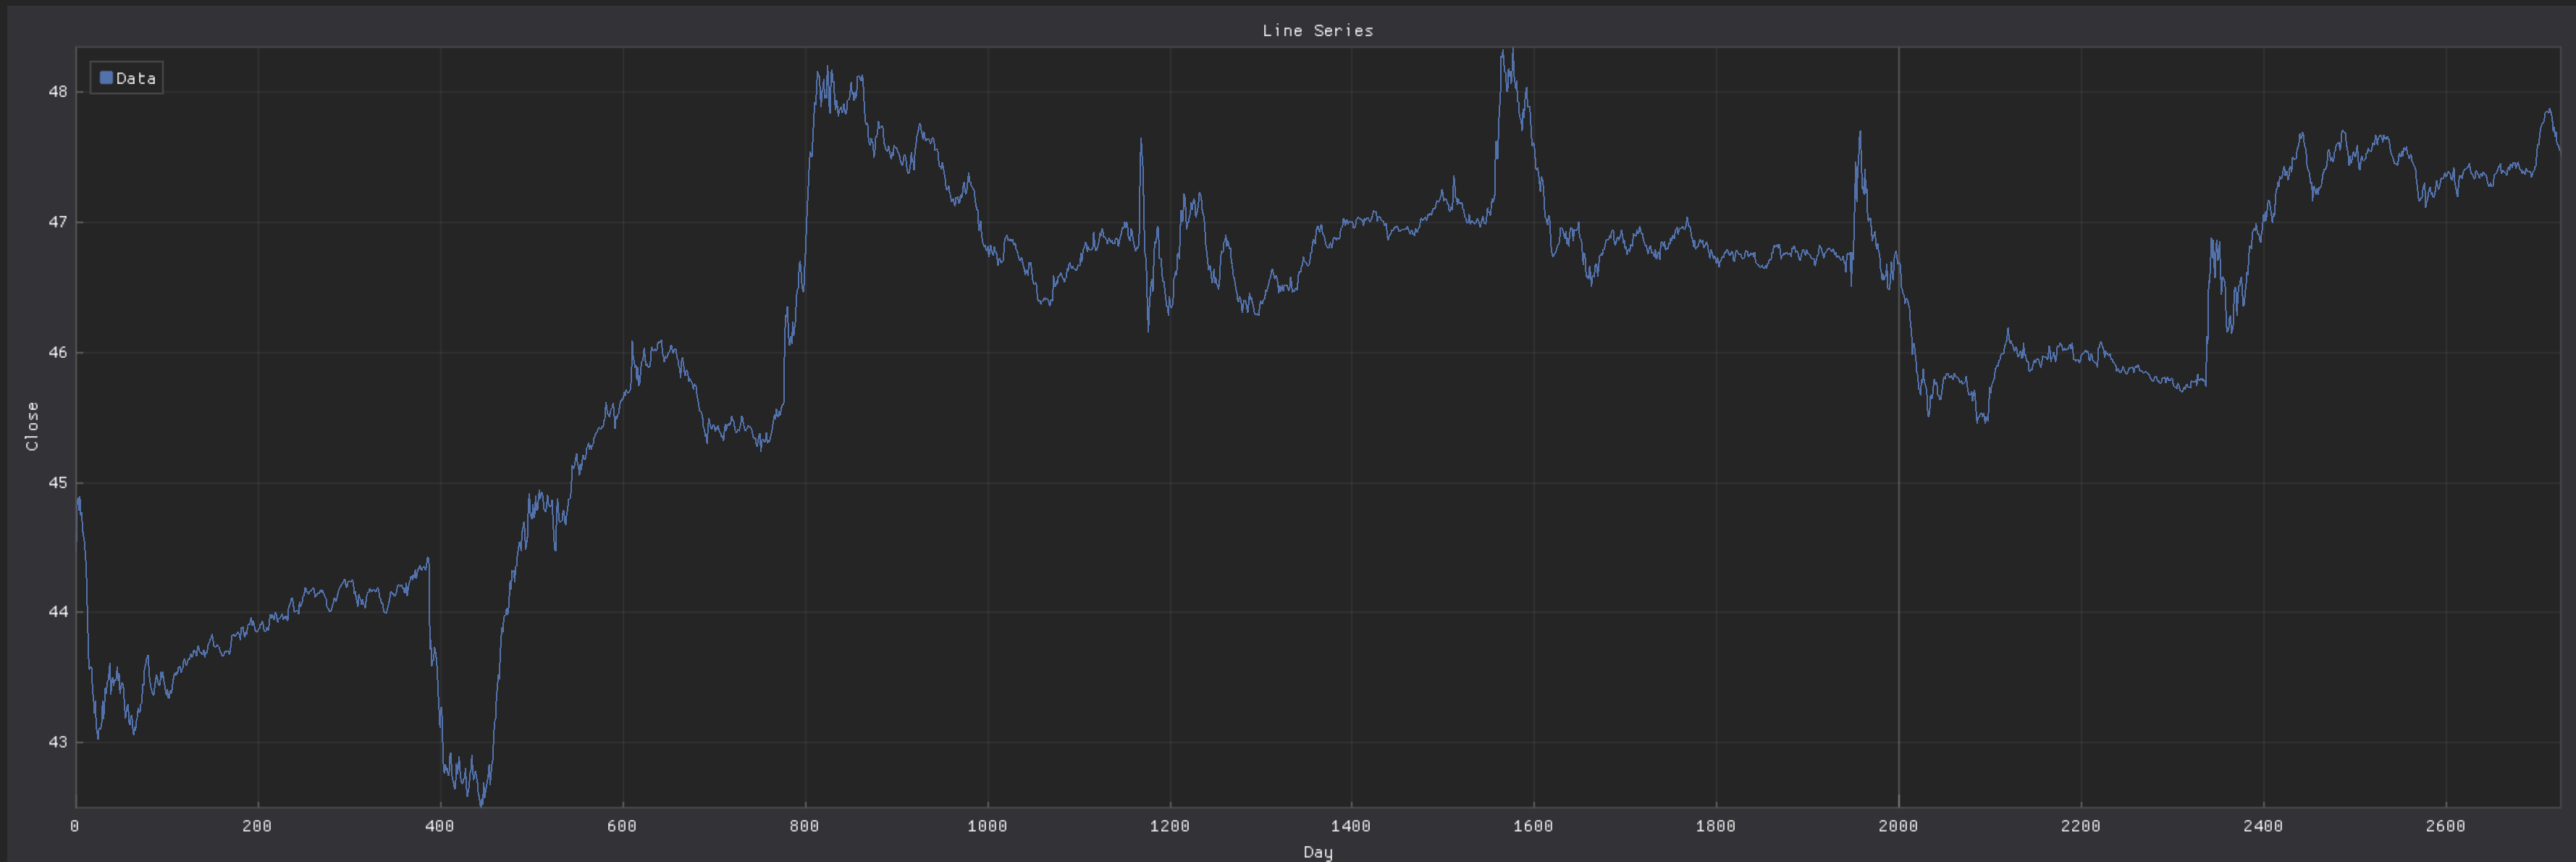
I a new learner of dearpygui so please help me with if this function already exist, I am unable to find after looking
in to the issues list and googling.
Contributor guide
Assessment
This issue has not been assessed yet.