hasura / hasura/graphql-engine
Monitoring: incorrect used connections shown while under load.
Open
k/bug
p/high
t/control-plane
- Dominant language
- TypeScript
- Stars
- 32.1k
- Forks
- 3k
- PR merge metrics
- PR metrics pending
Description
### Version Information
Server Version: 2.11.2
### Environment
Cloud
### What is the current behaviour?
May be related to #9002
While under load, with a configured max connection of 5, which we expect to sum to 10 (given 2 workers backing the project),
the monitoring tab shows 5 connections being used.
(ignore the incorrect 20 max connections shown here, this is a bug discussed in #9002)
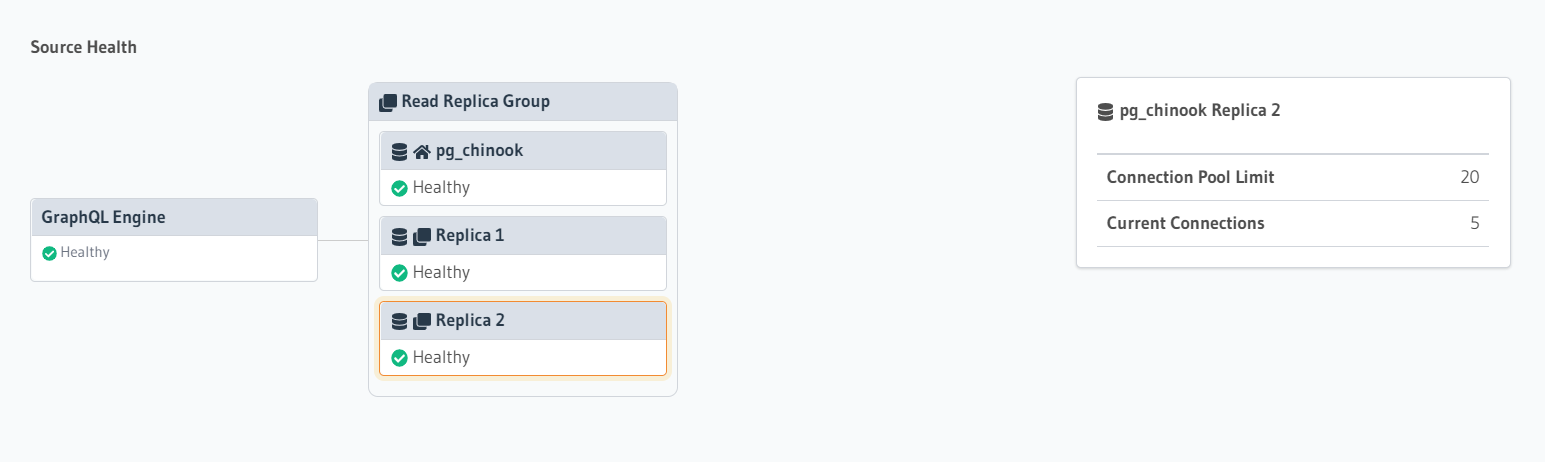
Connecting to the database directly shows the correct 10 connections being used.
### What is the expected behaviour?
The correct number of used connections should be displayed.
Contributor guide
Assessment
This issue has not been assessed yet.