hasura / hasura/graphql-engine
Confusions about data availability in the Hasura console's monitoring page
- Dominant language
- TypeScript
- Stars
- 32.1k
- Forks
- 3k
- PR merge metrics
- PR metrics pending
Description
### Version Information
Server Version: `v2.10.1-cloud.3`
### Environment
Cloud
### What is the current behaviour?
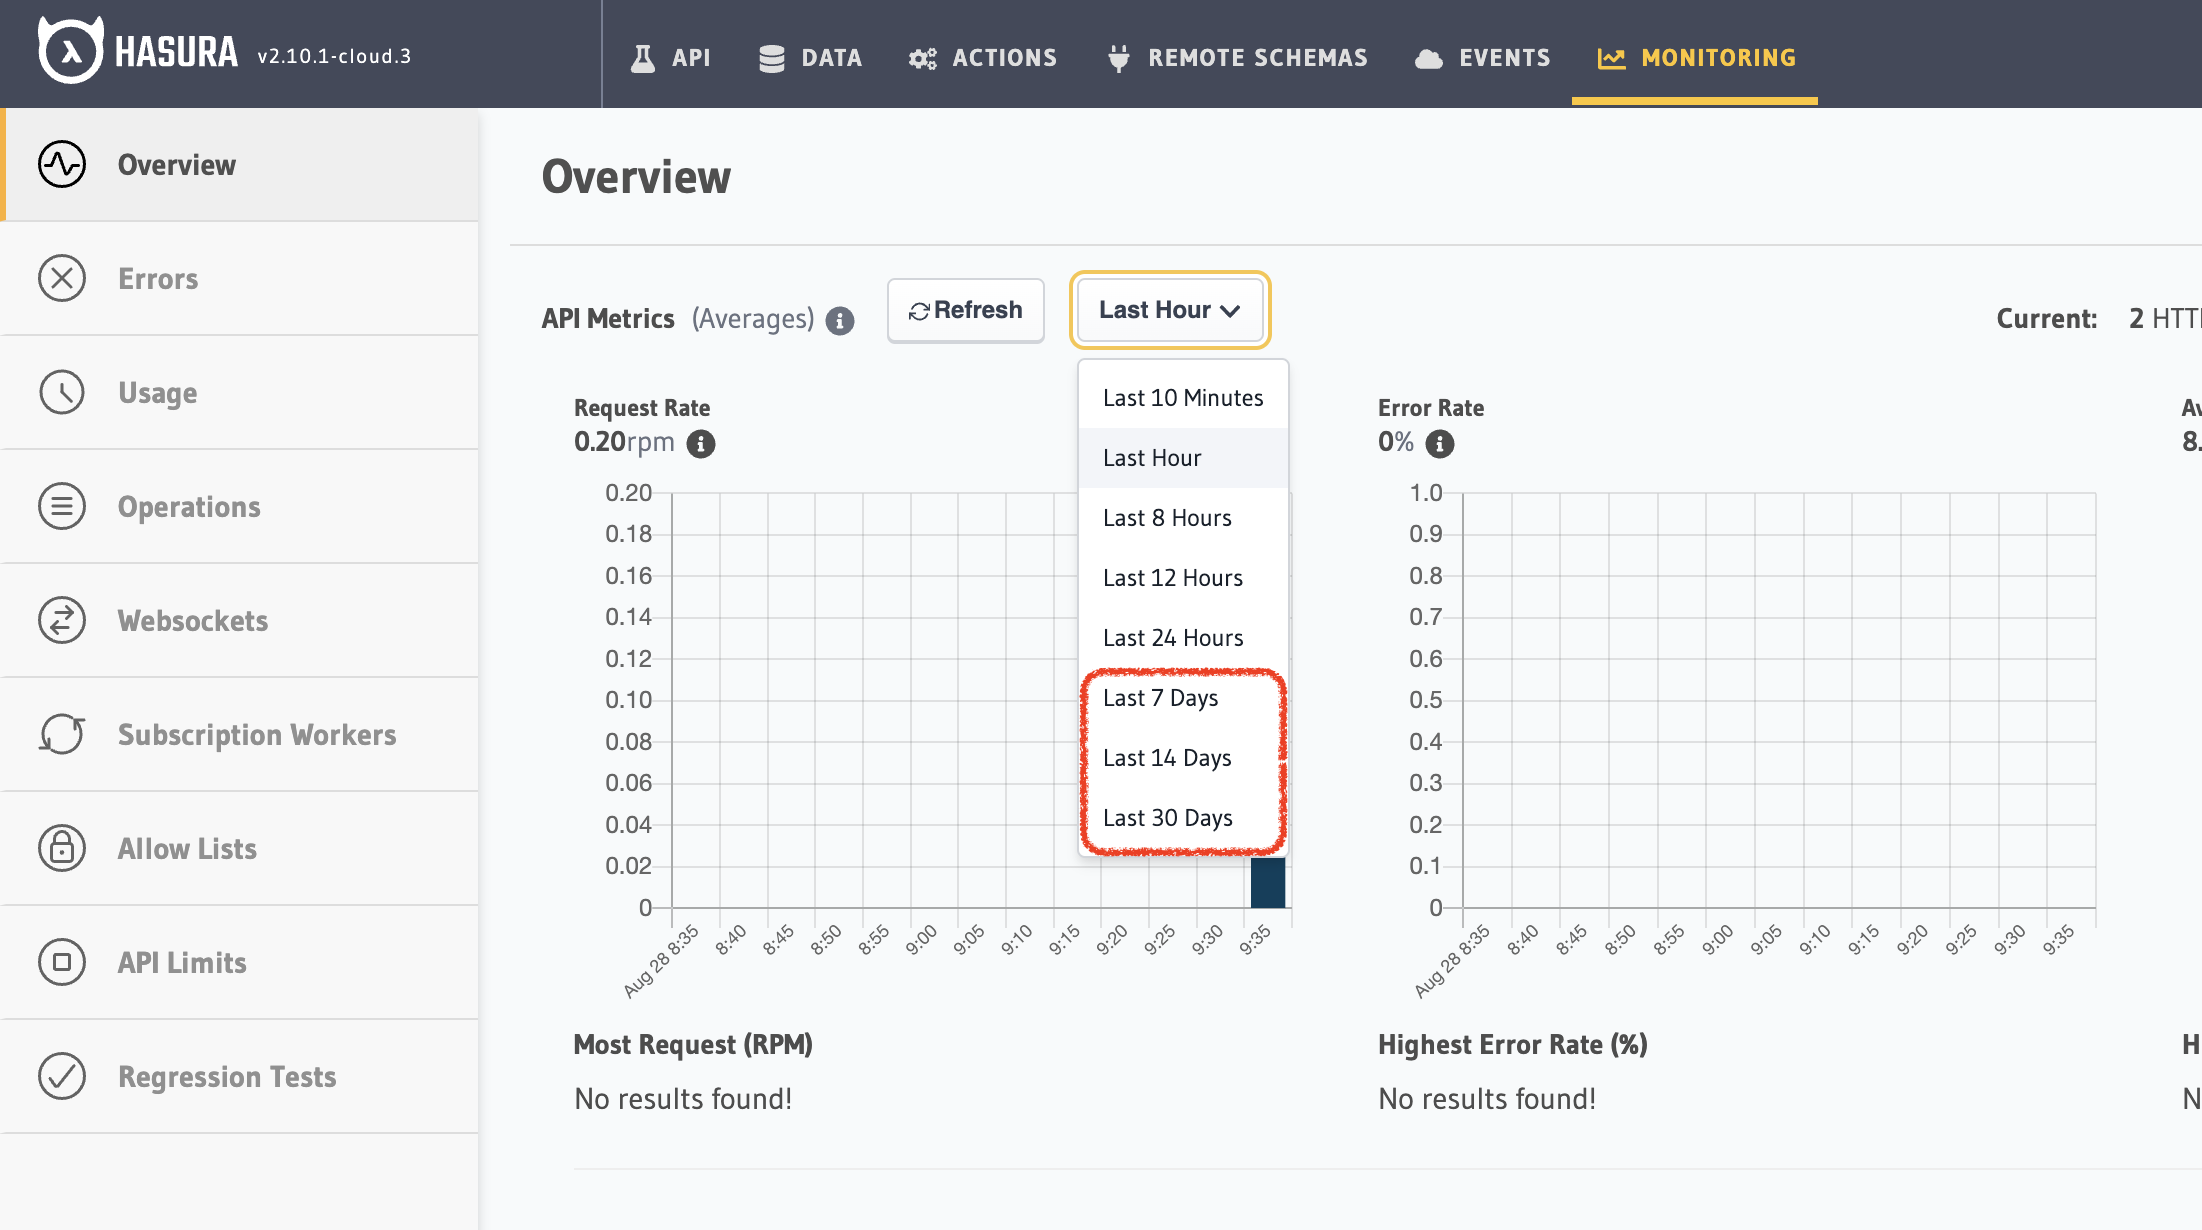
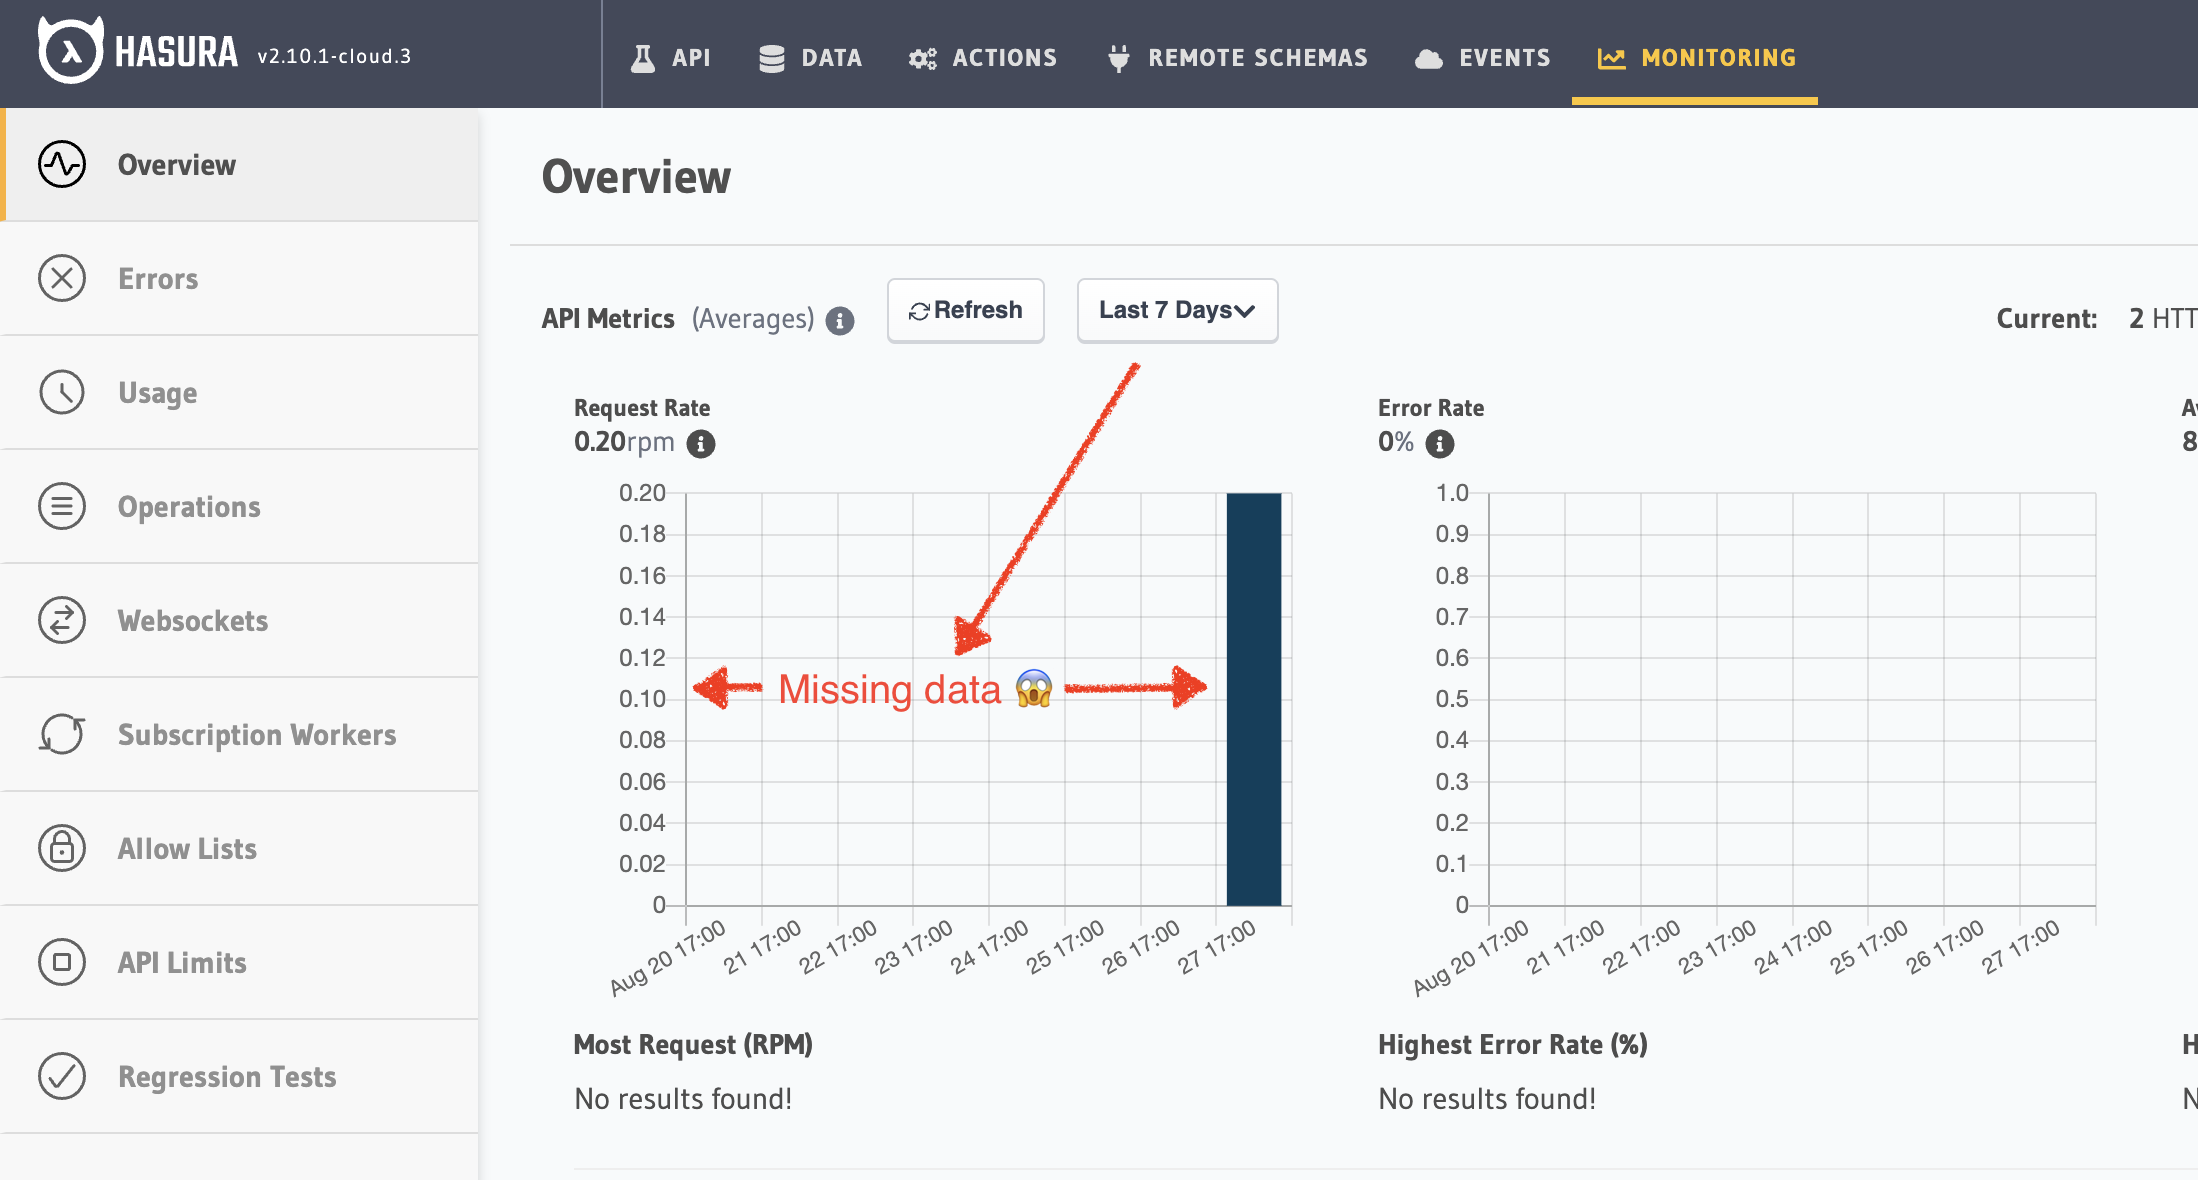
As a Cloud free tier or standard tier user, my logs are retained for only 24 hours (in the console; I do have the option of using an APM integration for a custom retention period). When using the Overview section of the Monitoring tab, there are dropdown options that allow choosing 7, 14 and 30 days worth of data, but there's obviously no data to be shown, leading to fear/confusion about something being off with my API:
### What is the expected behaviour?
The dropdown should make it clear that these options are available in higher tiers and somehow also let me know that an APM integration is also an option to solve this issue.
### How to reproduce the issue?
Head to https://cloud.hasura.io/project//console/pro and click on the 2nd dropdown.
Contributor guide
Research direction
Start at the Hasura Cloud console's Monitoring tab, especially the Overview section and its second dropdown. Check how the 7-, 14-, and 30-day options are presented for free and standard tiers; done means unavailable retention periods clearly explain the tier limitation and mention APM integration as an alternative.
Written by the indexing model from the issue text.
Assessment
- Tech stack
- typescript
- Domain
- cloud, observability
- Issue type
- Feature
- Difficulty
- 3/5
- Estimated time
- 1-2 days
- Activity status
- Stale
- Clarity
- Mostly clear
- Newbie friendliness
- 42/100