hasura / hasura/graphql-engine
Monitoring > Subscription Workers > Average Execution Time Graph X Index sorted incorrectly
- Dominant language
- TypeScript
- Stars
- 32.1k
- Forks
- 3k
- PR merge metrics
- PR metrics pending
Description
### Version Information
Server Version: Hasura Cloud v2.0.10-cloud.1
### Environment
Cloud, Safari Version 15.2 (17612.3.6.1.6) on Mac laptop
### What is the expected behaviour?
When selecting a filter time period the X index for the Average Execution Time Graph should be sorted by date and time.
### Keywords
execution time
### What is the current behaviour?
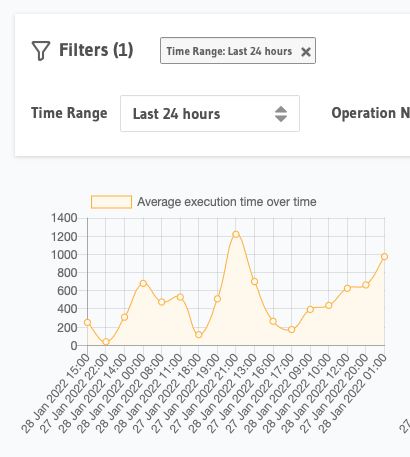
Sort order appears random, without sorting by date. Eg data for the 28th 1500 is before 27th 2200. This only appears to be wrong for the first graph.
### How to reproduce the issue?
1. Go into Monitoring
2. Go to the subscriptions page
3. Change filter to be 24 hours or longer
### Screenshots or Screencast
### Please provide any traces or logs that could help here.
N/A
### Any possible solutions?
### Can you identify the location in the source code where the problem exists?
### If the bug is confirmed, would you be willing to submit a PR?
Contributor guide
Research direction
Start at Monitoring > Subscription Workers and reproduce the issue on the subscriptions page with a 24-hour-or-longer filter. Trace the Average Execution Time Graph data and x-axis ordering; done means its points are consistently sorted by date and time, with the other graphs unaffected. No source file or test is named in the issue, so locating the relevant frontend entry point is part of the work.
Written by the indexing model from the issue text.
Assessment
- Tech stack
- typescript
- Domain
- frontend
- Issue type
- Bug
- Difficulty
- 3/5
- Estimated time
- 1-2 days
- Activity status
- Stale
- Clarity
- Mostly clear
- Newbie friendliness
- 35/100