hasura / hasura/graphql-engine
Monitoring tab shows misleading trace when remote schema relationship times out
- Dominant language
- TypeScript
- Stars
- 32.1k
- Forks
- 3k
- PR merge metrics
- PR metrics pending
Description
### Version Information
Server Version: 1.3.3
### Environment
EE
### What is the expected behaviour?
When viewing operation logs, a trace is available showing the elapsed time for each part of the request:
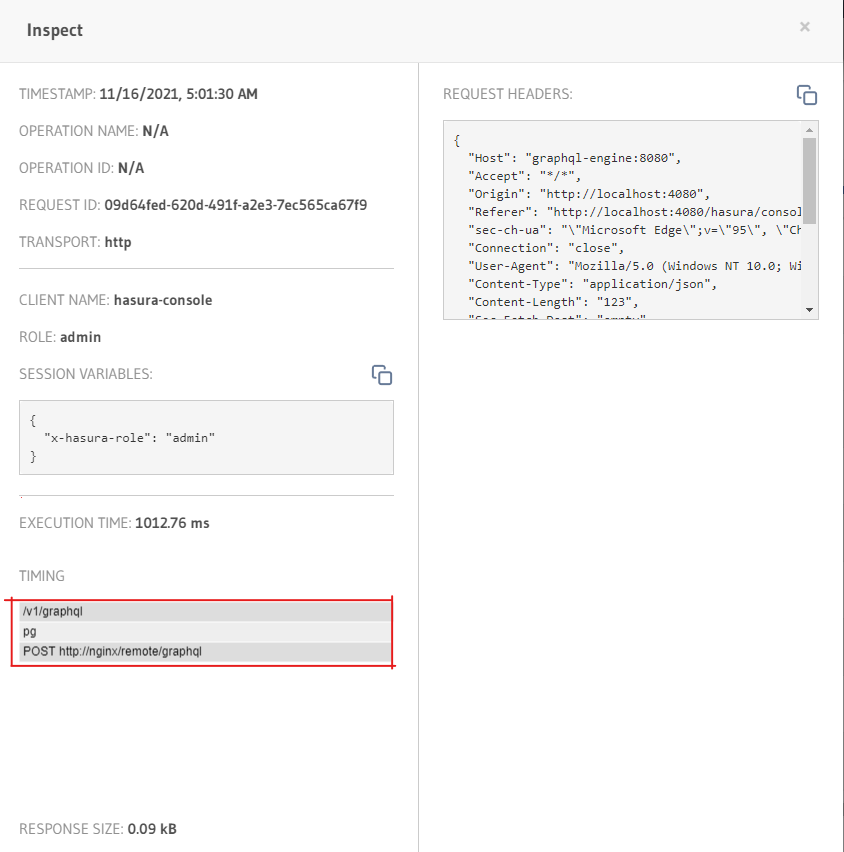
This trace includes an entry for the call to the remote schema, in the example above a `POST` request to `http://nginx/remote/graphql`
If the operation calls a remote schema, we see the time it took for the remote schema to respond.
If the call to the remote schema times out, we see the time it took before timing out.
However, if the remote schema is accessed via a remote schema relationship, and the remote schema times out, the trace does not show the remote schema call at all, an instead attributes the elapsed time to the database call.
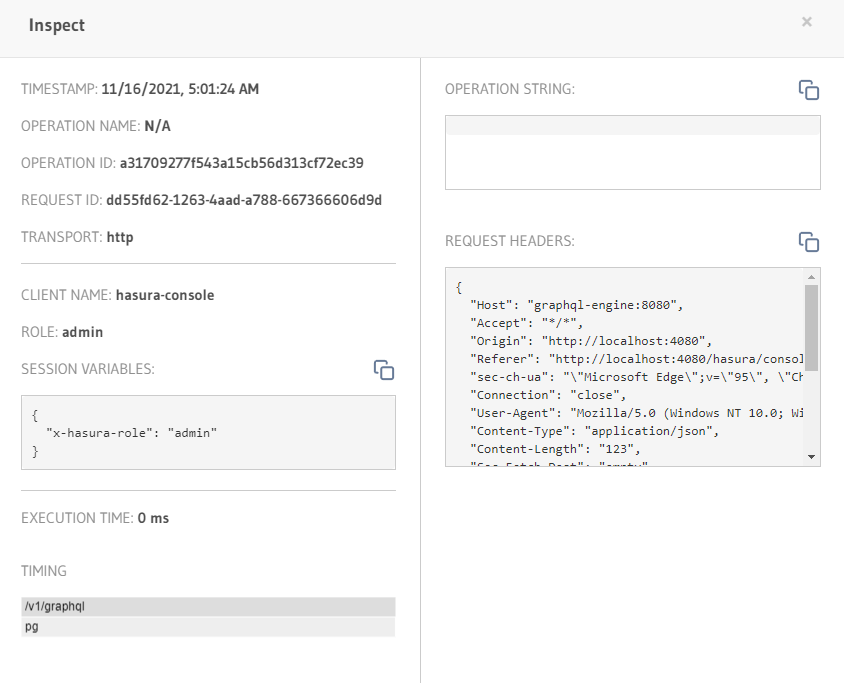
This can lead users to believe that whatever performance issue is causing the time out lies in the database call, which is inaccurate and misleading.
### How to reproduce the issue?
1. Connect a remote schema to a hasura instance. Set a timeout for the remote schema
2. Add a table with a field of the remote schema as remote schema relationship
3. Make a request to the table that includes the remote schema fields
4. Induce a timeout. In my case the remote schema would take longer to reply than the timeout.
5. Check the operation logs in the monitoring tab
I can demo a repro on request.
Contributor guide
Research direction
Start in the Monitoring tab's operation logs and reproduce the timeout through a remote schema relationship using the listed five-step scenario. Trace how the operation is recorded when the remote schema times out; done means the trace includes the remote schema call and its timeout duration instead of attributing the elapsed time to the database call.
Written by the indexing model from the issue text.
Assessment
- Tech stack
- graphql
- Domain
- observability
- Issue type
- Bug
- Difficulty
- 4/5
- Estimated time
- 3-5 days
- Activity status
- Stale
- Clarity
- Mostly clear
- Newbie friendliness
- 35/100