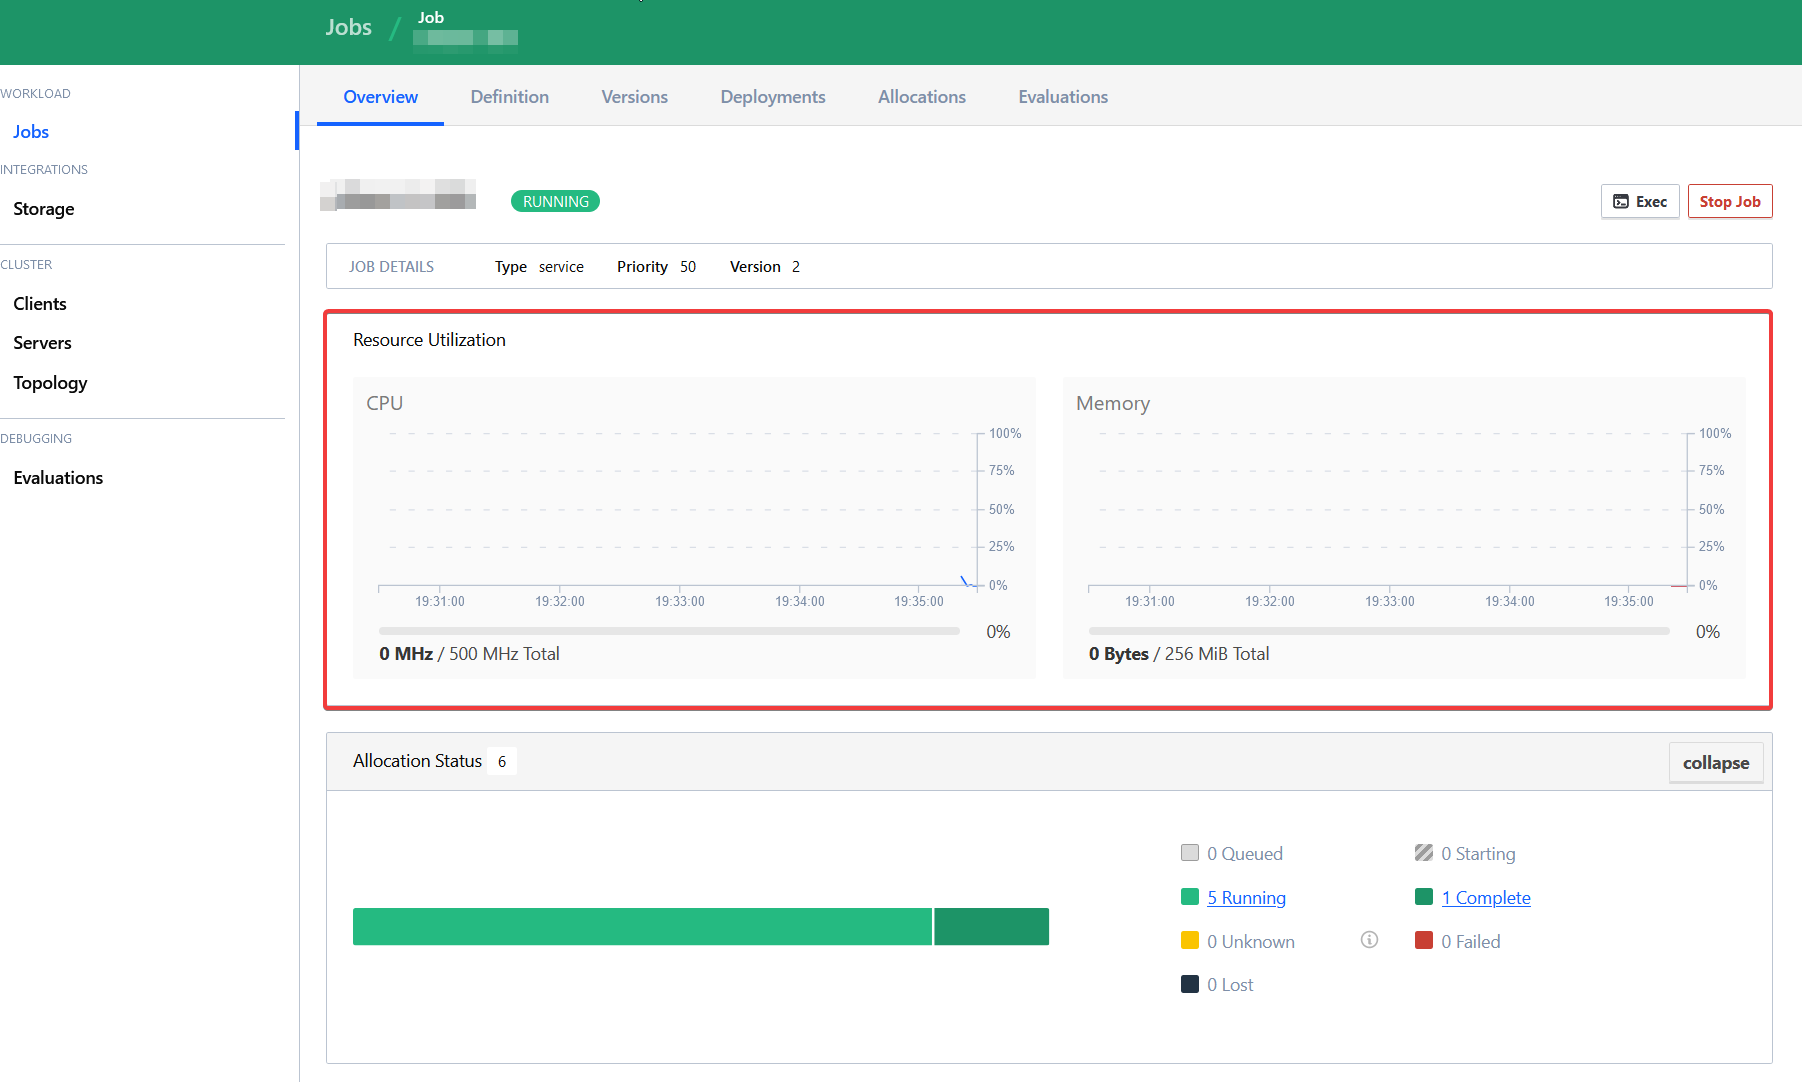
CPU and Memory summary in job overview
- Dominant language
- Go
- Stars
- 17k
- Forks
- 2.1k
- Avg merge
- 1d 9h
- Merged PRs (30d)
- 105
Description
### Proposal
It would be great if job overview provided overall `Resource Utilization` block for all allocations like it is available in the specific allocations.
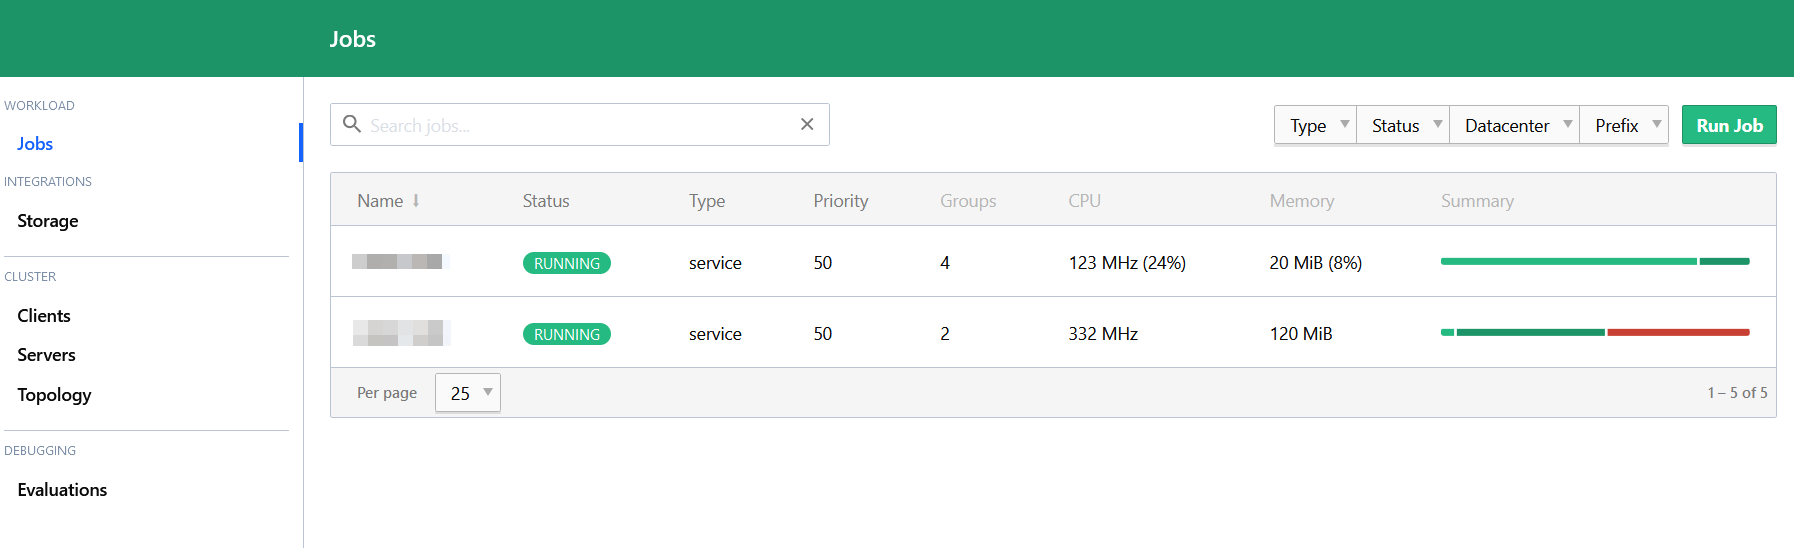
If possible, small counters or/and graphs in the job's table would be greatly useful too (not sure if percent values are needed here):
### Use-cases
Availability of resource utilization in the main view would allow to:
- notice potential issues faster and in more cases (e.g. when browsing current deployment state of a job)
- estimate cost of running a specific job on the cluster easier (with many groups/allocations, it becomes really cumbersome to sum the values without custom scripts)
Allocation level statistics allow diagnosing a specific task, which is more useful if we already know about the problem. This should allow better overview of general job health.
Contributor guide
No contributing guide indexed for this repository
Research direction
Start at the job overview and compare it with the existing allocation-level Resource Utilization view shown in the proposal. Determine how CPU and memory totals should be presented for all allocations, including the optional job-table counters or graphs. Done means the overview exposes aggregate utilization and the resulting display is verified against the stated use cases.
Written by the indexing model from the issue text.
Assessment
- Domain
- frontend
- Issue type
- Feature
- Difficulty
- 4/5
- Estimated time
- 3-5 days
- Activity status
- Stale
- Clarity
- Mostly clear
- Newbie friendliness
- 35/100