Implement Sankey plots
Open
feature
plot
ui
- Dominant language
- Python
- Stars
- 4.3k
- Forks
- 371
- Avg merge
- 26d 1h
- Merged PRs (30d)
- 1
Description
#### Description
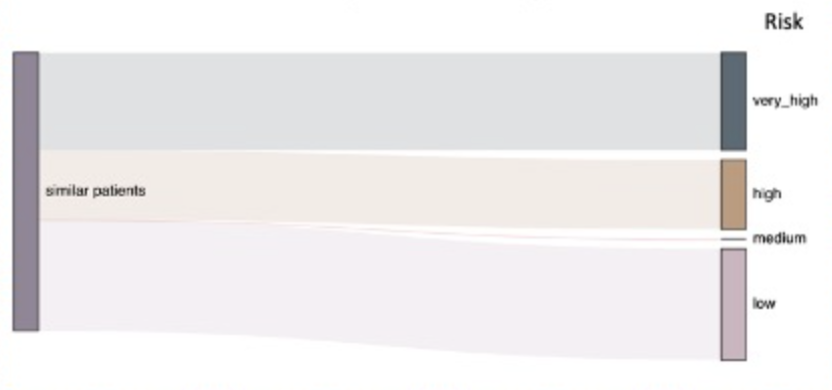
Shankey plots are very useful in showing flows such as in : patient distribution, cash allocation, marketing channel attribution.
They can be a useful visualization of unsupervised mapping, shapley values analysis etc
Contributor guide
Research direction
No files, tests, or entry points are mentioned. Start by locating the existing plotting and visualization components, then define the supported flow data and verify that a Sankey plot can represent the examples described in the issue.
Written by the indexing model from the issue text.
Assessment
- Domain
- data-visualization
- Issue type
- Feature
- Difficulty
- 5/5
- Estimated time
- Over a week
- Activity status
- Stale
- Clarity
- Needs clarification
- Newbie friendliness
- 25/100