Add Agent Benchmarking
- Dominant language
- Go
- Stars
- 11.7k
- Forks
- 802
- Avg merge
- 1d 19h
- Merged PRs (30d)
- 80
Description
### Context
A lot of people are asking about various performance characteristics of pyroscope. Common asks include:
* how many individual clients can one server support?
* how much does pyroscope agent affect performance? How much extra memory do I need to provision per pod for pyroscope agent?
We did some of this testing about 6 months ago and came up with the 1-2% number that we quote for agent performance hit. The problem is that:
* the number is pretty much anecdotal
* not reproducible / verifiable by users
* we did this testing once a long time ago, and since then made a bunch of changes, so performance could have improved or could have gotten worse, we don't really know.
We already started doing some benchmarking, the code can be found here: [/benchmark](https://github.com/pyroscope-io/pyroscope/tree/main/benchmark). However, this suite needs more polishing and it currently only benchmarks the server. We should probably use it as a base for this project.
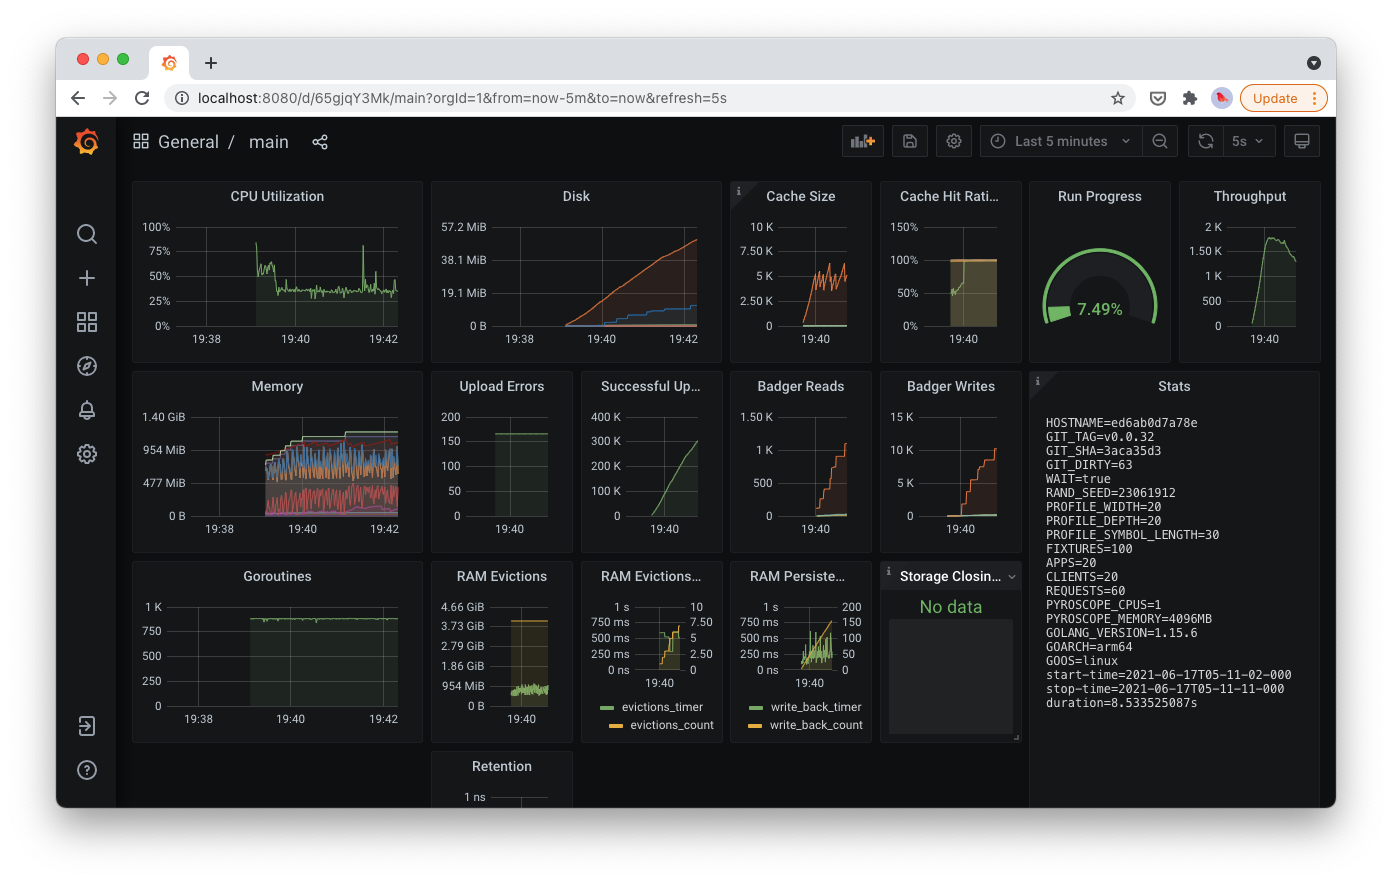
### Proposed Solution
We need to come up with a suite of benchmarks for both server and all types of clients we support (.net, ruby, go, etc).
### Other Considerations
* This benchmark suite has to be reproducible by users and developers
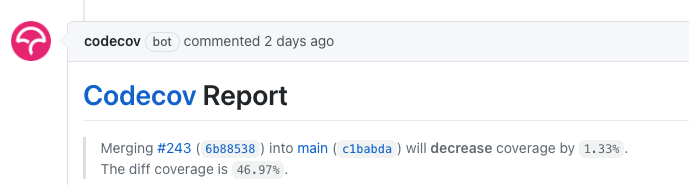
* We need to have some automation around this and have benchmarking results stored somewhere for each release, and ideally for each commit. This way we can track progress over time. It would be the best if we could have some job run on jenkins for each PR and generate a diff of performance metrics for main branch and given PR, e.g something similar to what codecov does:
* I imagine for some of these metrics there would be significant differences depending on configuration parameters provided. For example, I imagine server throughput would change significantly between having a) 30 clients report data for the same app vs b) having 30 clients report data for 30 different apps. I propose that when we pick configuration parameters we make best guesses about what an average user's app configuration is going to be. Would love to hear other suggestions though.
### Metrics For Server
* [ ] throughput in profiles per seconds or something like that
* [ ] how many clients can one server support
* [ ] amount of storage required per day of profiling data
* [ ] TODO: come up with more metrics
### Metrics For Agents
* [ ] CPU overhead of adding pyroscope integration
* [ ] #361
* [ ] network overhead (e.g what's the size of one 10-second profile chunk)
* [ ] TODO: come up with more metrics
### Proposed Milestones
* [x] finish the list metrics we want to track (see a few paragraphs above)
* [x] have a good server benchmark suite
* [ ] have a good client benchmark suite for each integration
* [ ] have jenkins track performance over time
* [ ] have jenkins also generate diffs / summaries for each PR
Contributor guide
No contributing guide indexed for this repository
Assessment
This issue has not been assessed yet.