[bug][pyroscope] Tag resolution doesn't appear to be accurate in profiles submitted to /pyroscope/ingest for ruby
- Dominant language
- Go
- Stars
- 11.7k
- Forks
- 802
- Avg merge
- 1d 19h
- Merged PRs (30d)
- 80
Description
#### Describe the bug
We see callchains that obviously have the wrong stack associated with them when we filter profiles by tags
#### To Reproduce
Use latest weekly build [weekly-f8-1e364093](https://hub.docker.com/layers/grafana/phlare/weekly-f8-1e364093/images/sha256-b8c99494fa8fe73d9499bacd4288cee4583e11be765beafc842b5761702256fc?context=explore) which implements `/pyroscope/ingest`
I wrote is a simple server HTTP server used to intercept the pyroscope payload and save it for analysis, which I also used in https://github.com/grafana/pyroscope/issues/2073:
```
package main
import (
"fmt"
"io"
"os"
"log"
"net/http"
)
var n = 0
func main() {
// Set routing rules
http.HandleFunc("/", Tmp)
//Use the default DefaultServeMux.
err := http.ListenAndServe(":4040", nil)
if err != nil {
log.Fatal(err)
}
}
func Tmp(w http.ResponseWriter, r *http.Request) {
fmt.Printf("request %d %+v\n", n, r)
f, _ := os.Create(fmt.Sprintf("profile%d.pb.gz", n))
defer f.Close()
io.Copy(f, r.Body)
defer r.Body.Close()
n++
}
```
Next we'll use the pyroscope simple ruby app:
https://github.com/grafana/pyroscope/tree/main/examples/ruby/simple
We'll override the server address to point to the interceptor server.
Here is one such captured profile:
[foo.pb.gz](https://github.com/grafana/phlare/files/11165596/foo.pb.gz)
We can see a breakdown of the tags in the profile:
```
go tool pprof -tags ../foo.pb.gz
Main binary filename not available.
function: Total 619.0
485.0 (78.35%): slow
134.0 (21.65%): fast
hostname: Total 619.0
619.0 ( 100%): test
region: Total 619.0
619.0 ( 100%): us-east
```
We'll submit this along to Phlare as so:
```
curl --data-binary @./foo.pb.gz http://127.0.0.1:4100/pyroscope/ingest\?name\=foo&from\=1680742794\&until\=1680742804\&spyName\=rbspy\&sampleRate\=100\&format\=pprof
```
When we view the resulting profile in the Phlare UI, we get this when we filter with `{ pyroscope_app="foo", function="fast"}`:
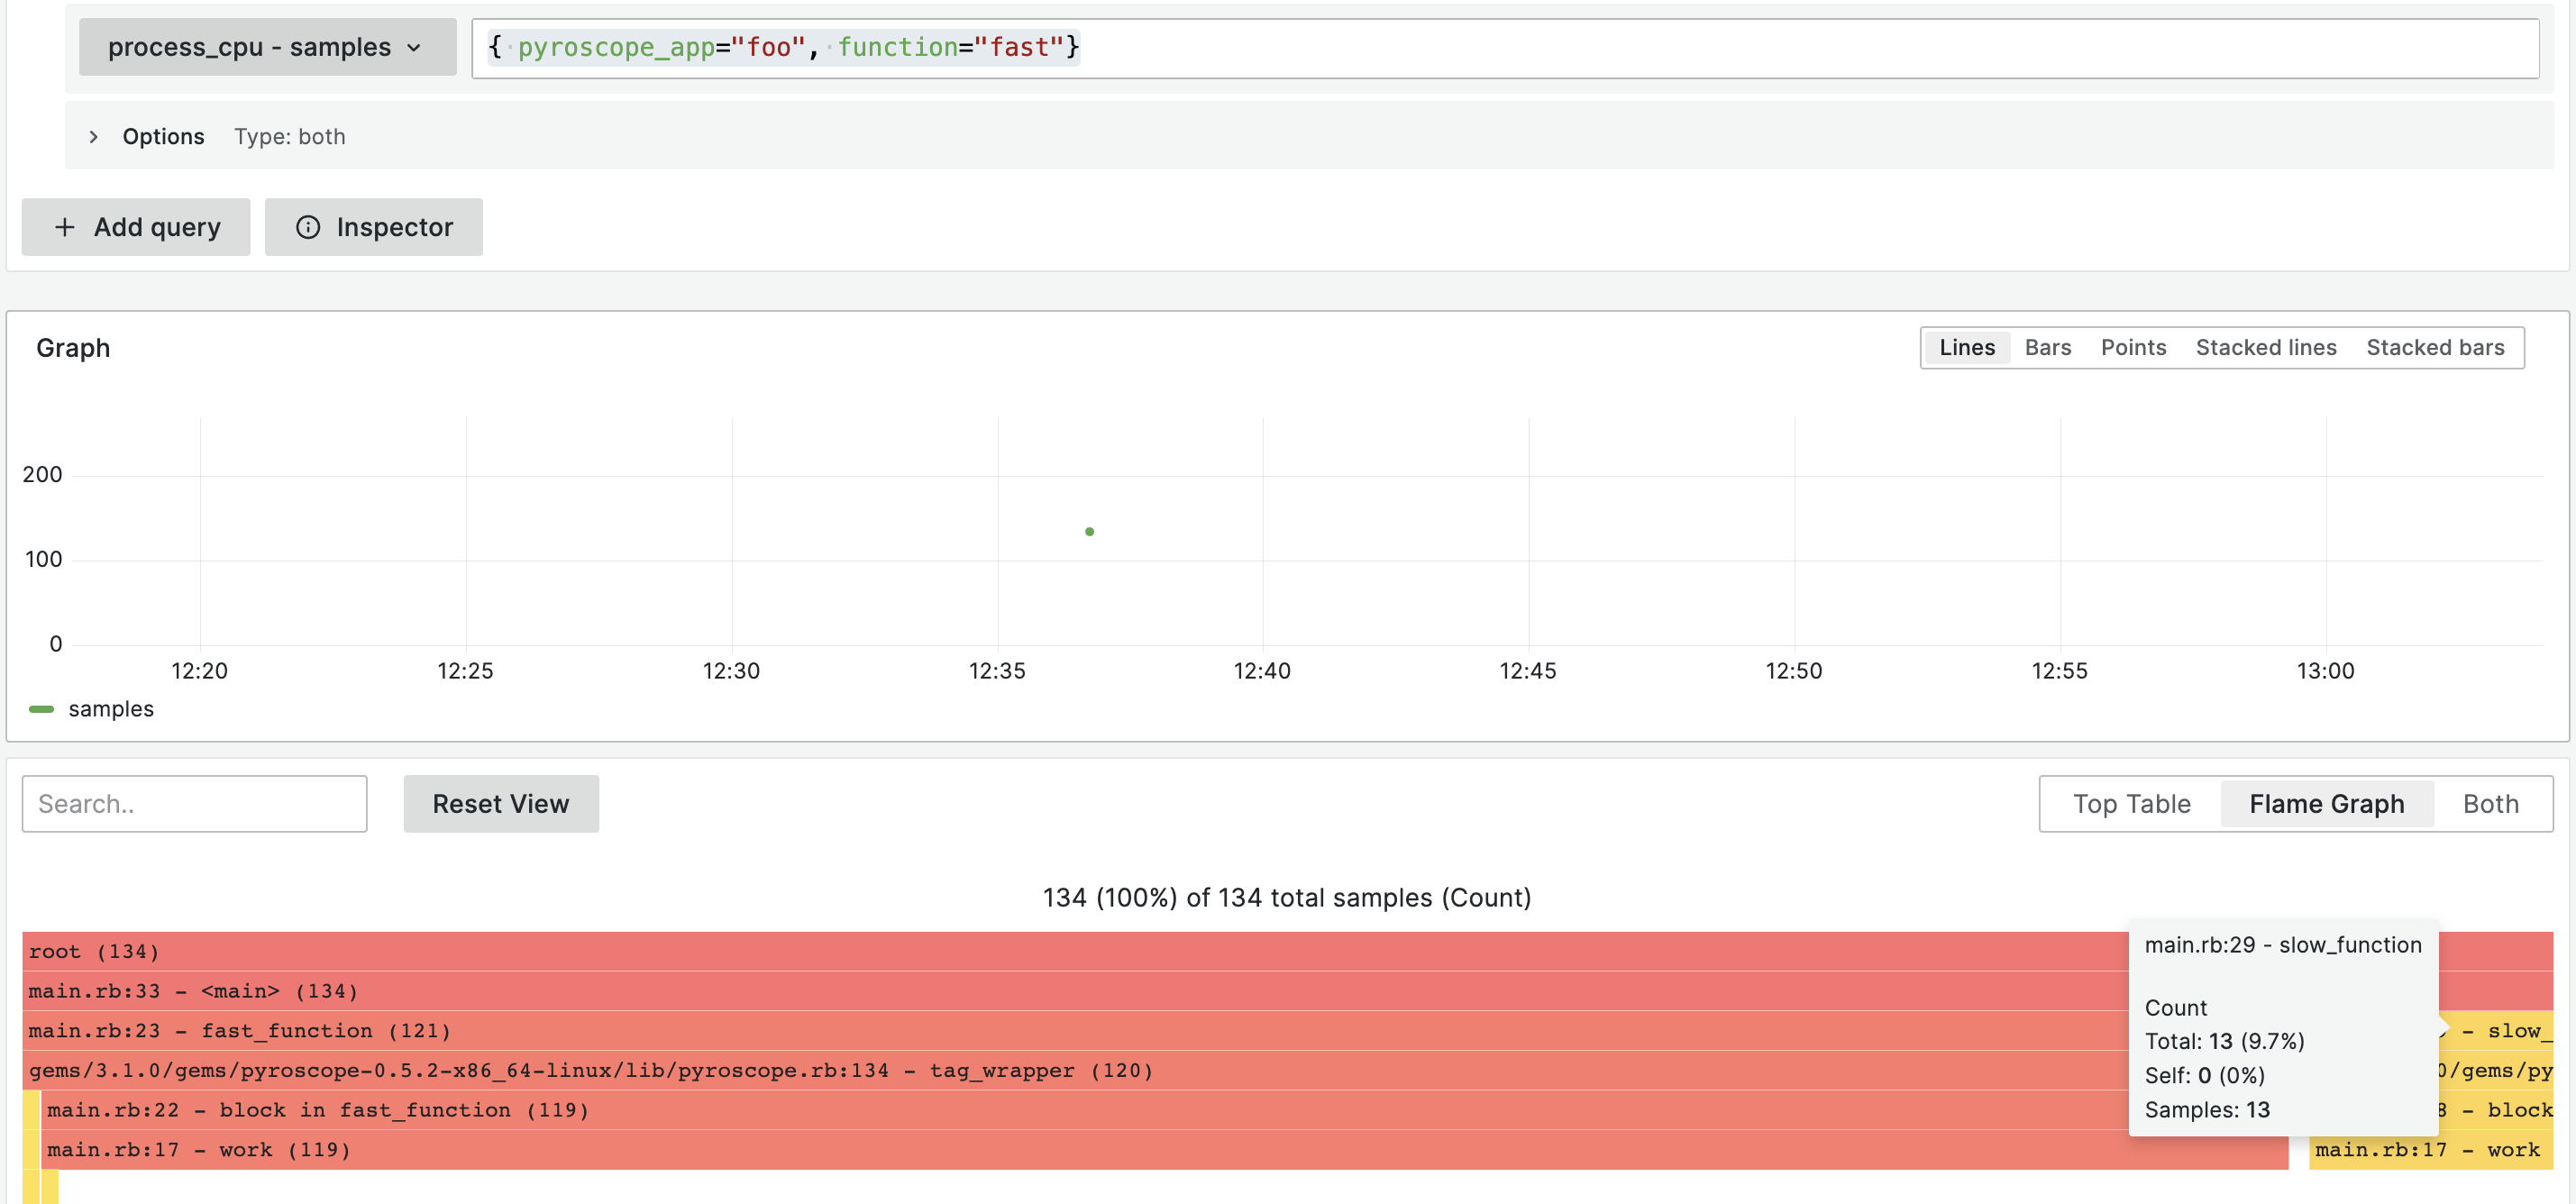
We shouldn't expect to see the frame `slow_function` here, as the tags should be mutually exclusive:
```
def fast_function
Pyroscope.tag_wrapper({ "function" => "fast" }) do
work(20000)
end
end
def slow_function
Pyroscope.tag_wrapper({ "function" => "slow" }) do
work(80000)
end
end
while true
fast_function
slow_function
end
```
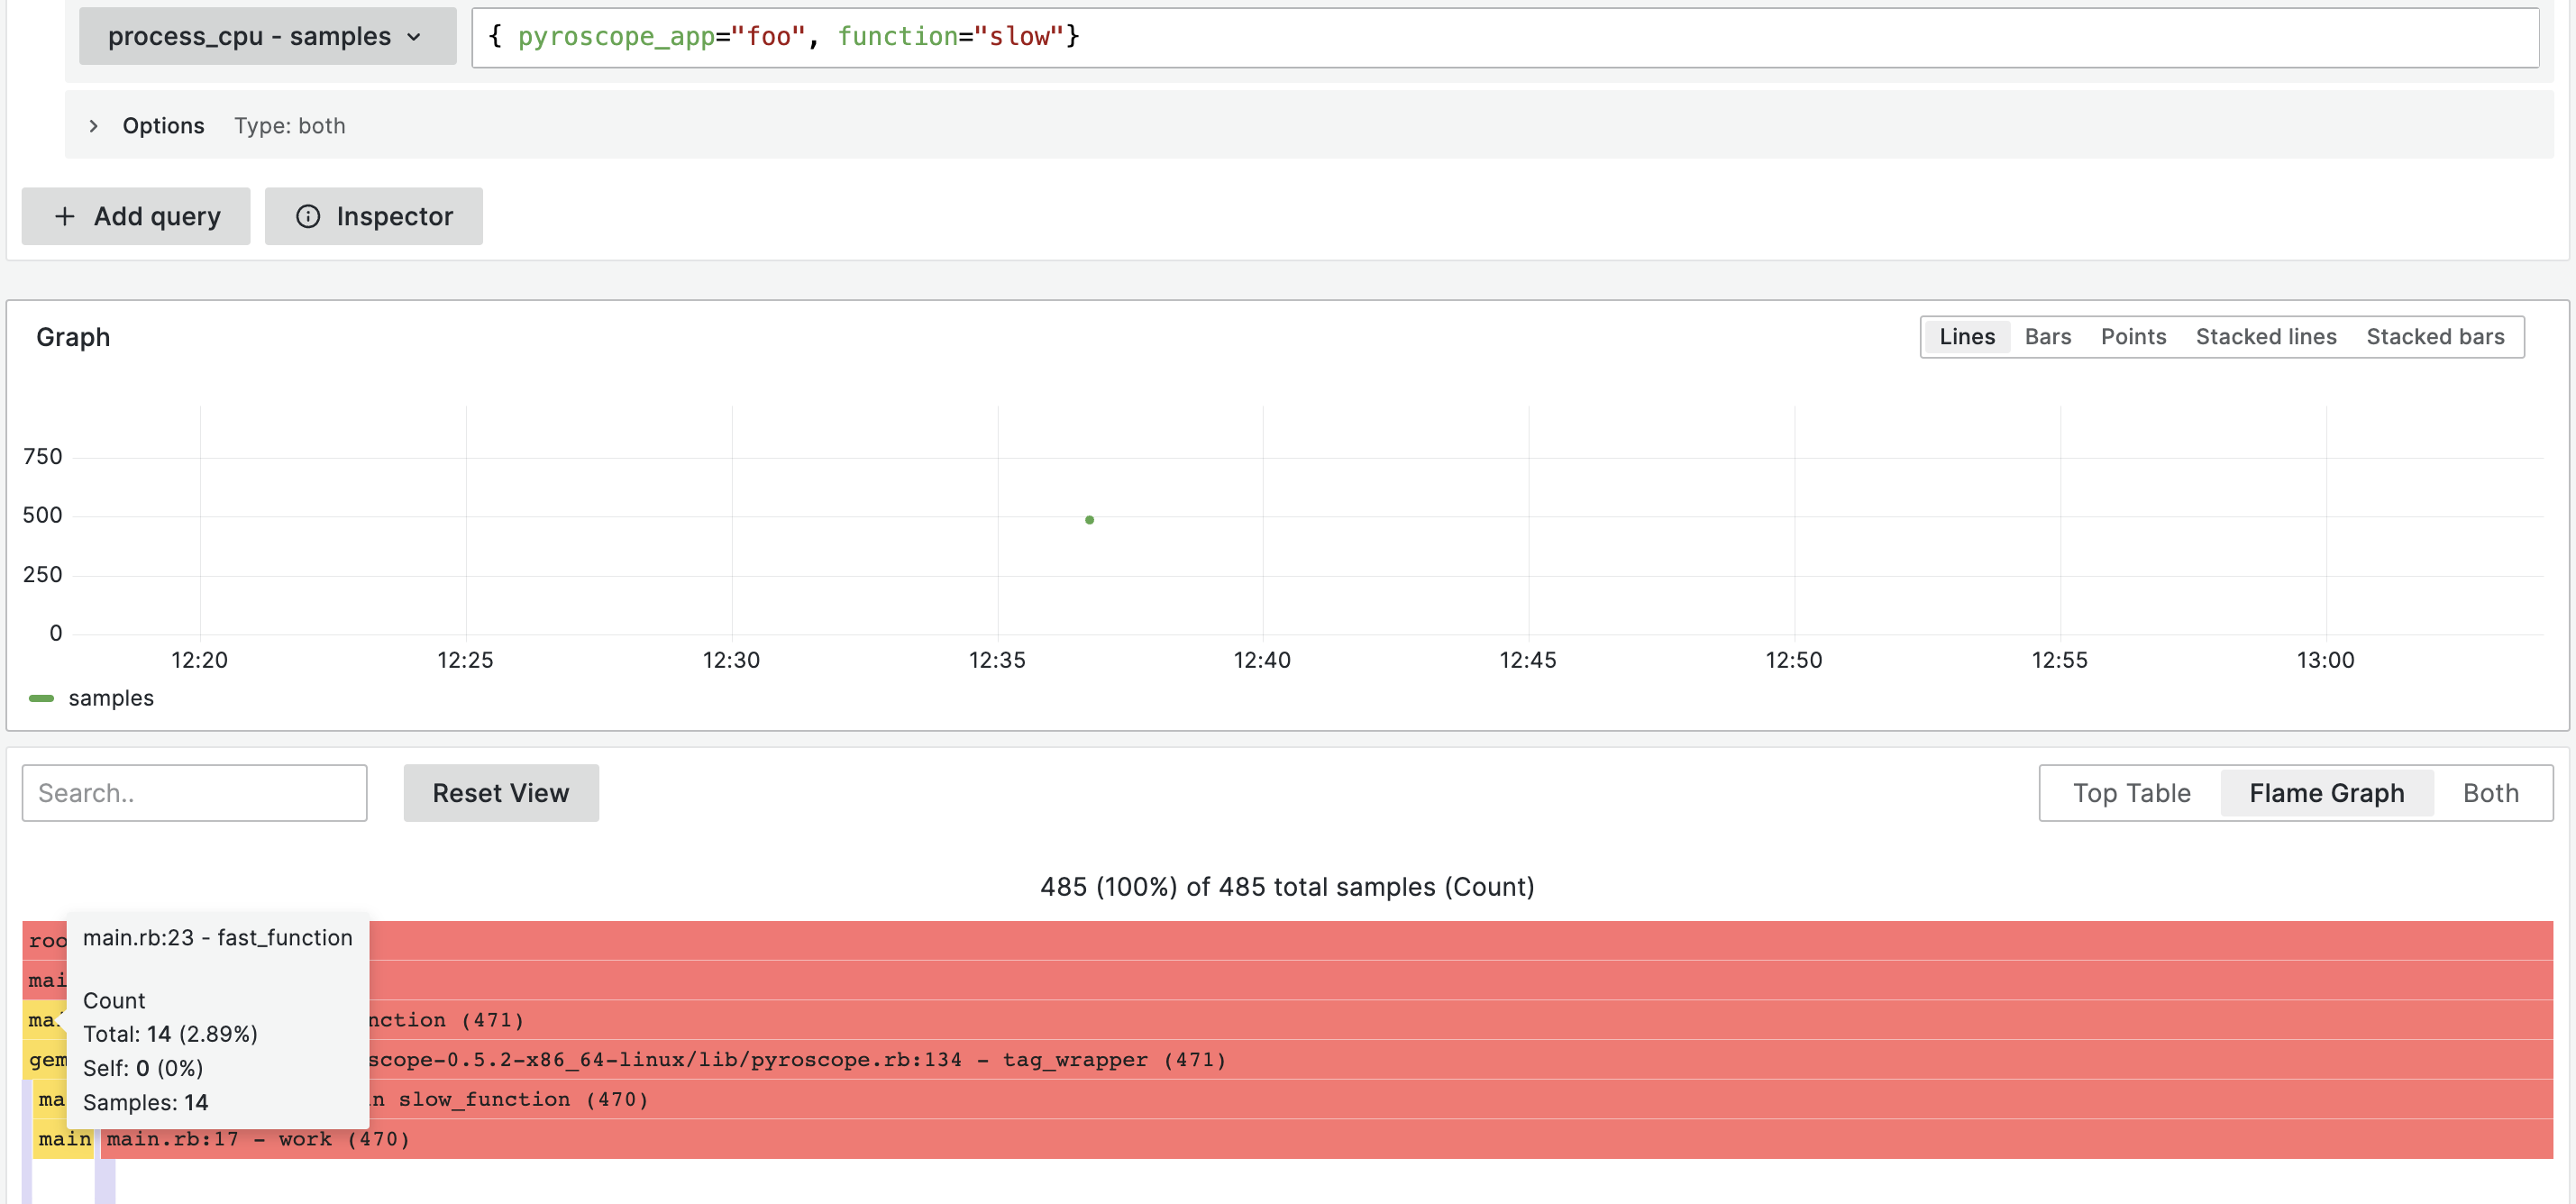
And vice versa, if we query `{ pyroscope_app="foo", function="slow"}`:
#### Expected behavior
The scope of the tags should be accurate. Specifically:
- We should never expect to see samples with callchains containing `slow_function` tagged as `function: fast`
- We should never expect to see samples with callchains containing `fast_function` tagged as `function: slow`
#### Environment
- Infrastructure: Kubernetes
- Deployment tool: jsonnet + custom tooling
#### Additional Context
I originally suspected that this was happening here:
https://github.com/grafana/phlare/blob/4639eee074662648e4e0c9e311bb0ad9aab516cf/pkg/ingester/pyroscope/ingest_adapter.go#L104-L112
The tag is applied to the entire series, but I'm not sure if `pi *storage.PutInput` is scoped only to the particular tag, I would guess that it is not? How is the "tag set" determined?
It could also be that the problem is a bug in the ruby collector, as I notice that the output from `go tool pprof -tags` matches the sample counts we see exactly, suggesting that it could be a source data error and not a bug in the ingestion endpoint, ie:
- What if 14/485 of the source samples tagged as "slow" but actually for "fast_function" were misattributed by the pyroscope ruby gem?
- Likewise, 13/134 of the source samples tagged as "fast" but actually for "slow_function"
Contributor guide
No contributing guide indexed for this repository
Assessment
This issue has not been assessed yet.