Support Stacked bar chart for tag explorer timeline
Open
- Dominant language
- Go
- Stars
- 11.7k
- Forks
- 802
- Avg merge
- 1d 19h
- Merged PRs (30d)
- 80
Description
Someone requested that it would be nice to see the tag explorer timeline with a stacked bar breakdown of resource usage by grouped_by value (i.e. cpu) instead of each grouped_by value being a separate series:
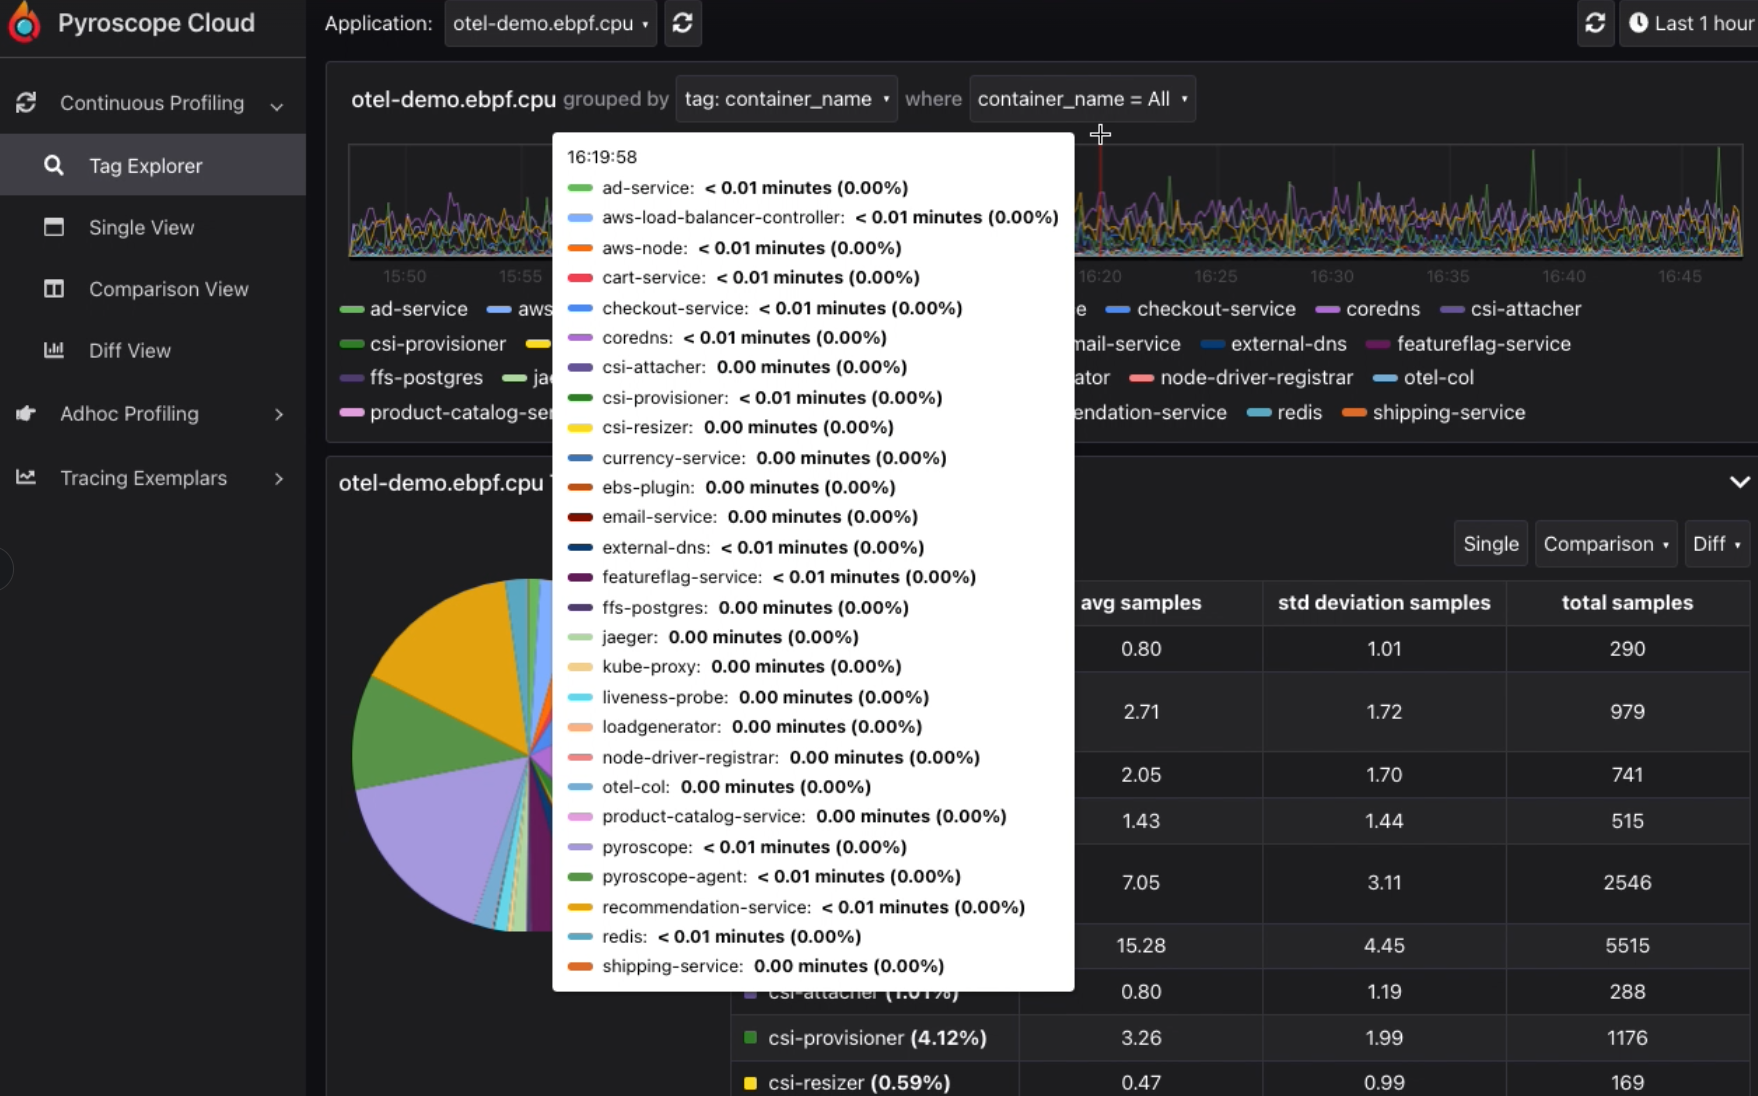
In order to do this we will need to show fewer datapoints on the timeline (i.e. instead of every 10s we may need show a datapoint per every minute so that they can be wide enough that they are readable
Contributor guide
No contributing guide indexed for this repository
Assessment
This issue has not been assessed yet.