gitthermal / gitthermal/thermal
Repository stats
- Dominant language
- Vue
- Stars
- 455
- Forks
- 34
- PR merge metrics
- No merged PRs in 30d
Description
## Description
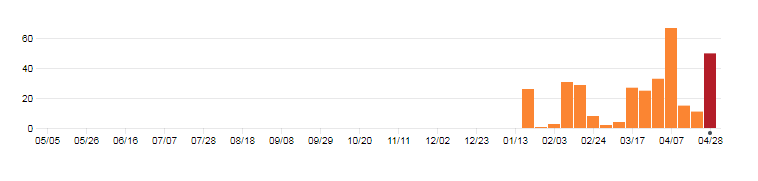
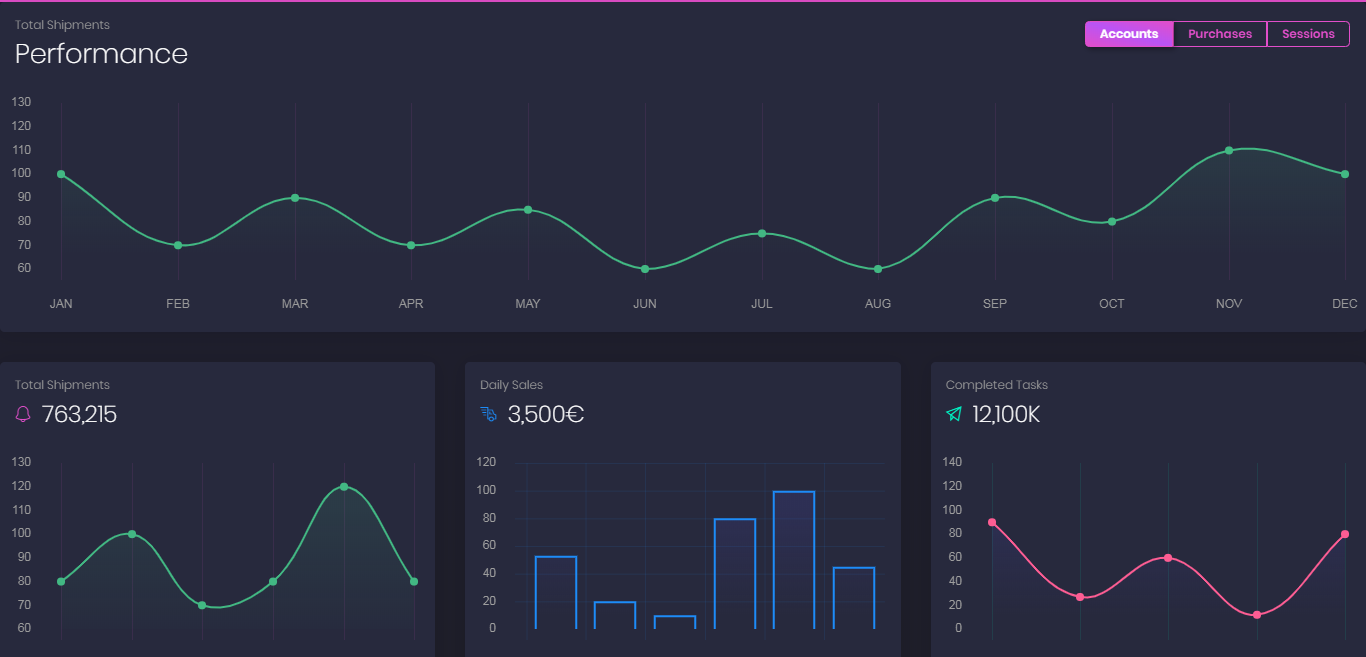
Add graphs and charts to show data in some kind of visualized way.
User can visualize the statistics of their repositories, keep track of what the contributors have done, get analytical data for running retrospectives and plan their future work while making informed decisions.
It is always very inspiring to watch your projects evolve by checking graphs from time to time. You can track your progress, see the work that has been done and feel accomplished.
## To-Do
- [x] Create & add stats #49
- [ ] Improve charts design
- [ ] Create cards based sections
## Screenshots
| | |
| --- | --- |
|  |  |
## Links
- [https://bitbucket.org/blog/awesome-graphs-for-bitbucket-visualized-statistics-for-git-and-mercurial-repositories](https://bitbucket.org/blog/awesome-graphs-for-bitbucket-visualized-statistics-for-git-and-mercurial-repositories)
- [https://www.creative-tim.com/product/vue-black-dashboard](https://www.creative-tim.com/product/vue-black-dashboard)
Contributor guide
Assessment
This issue has not been assessed yet.