Feature request: Spectrum Viewer for Audio Files
- Dominant language
- JavaScript
- Stars
- 35.8k
- Forks
- 4.1k
- Avg merge
- 2d 26m
- Merged PRs (30d)
- 33
Description
**Is your feature request related to a problem? Please describe.**
Simple Information can be encoded in audio files by literally "painting" frequencies in the spectrum. It would be quite useful to have this feature added to CyberChef.
**Describe the solution you'd like**
A new operation called "Spectrum Viewer" or "Spectrum Analyzer" could be added that processes audio files and converts them into an image representing the spectrum graph. This Operation could benefit from a few options such as:
- Logarithmic vs. Linear Frequency Display Scale
- Minimal and Maximal Display Amplitude
- "Viewframe" to select which part of the audio file you want to convert (e.g. just 10 seconds instead of the whole minute for example)
- Some sort of "Resolution"/FFT-Size to set how much detail the output image has.
Simply uploading the audio file, and getting an image that you can process or download further would be marvelous.
**Describe alternatives you've considered**
There are already quite a few tools out there to view frequency spectrums and most audio programs have this feature implemented aswell.
https://www.dcode.fr/spectral-analysis This one for example renders the spectrum as a moving image in real time when playing, but the resolution is quite low.
Programs with Frequency Spectrum features:
- Audacity
- SpectraLayers
**Additional context**
Example Images for hidden Data:
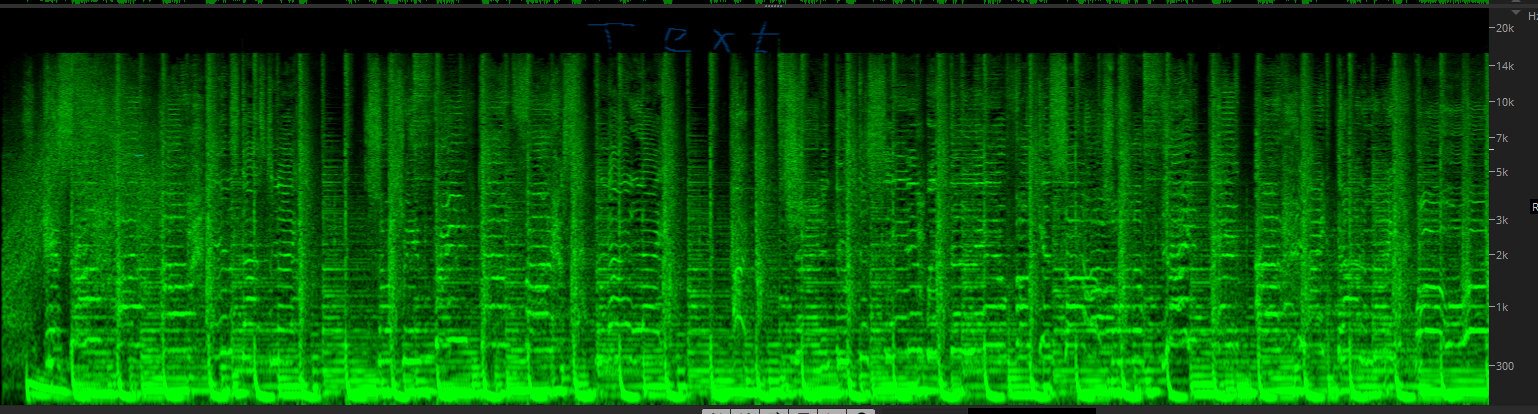
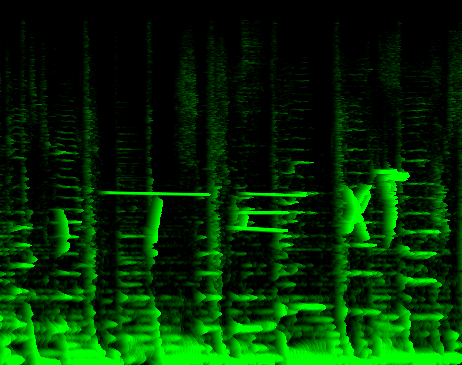
A hard cut of the frequencies can be seen at around 16kHz as well. The space above gives plenty of room to hide your visual data.
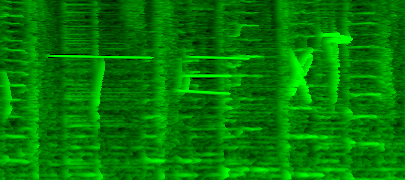
Sometimes text can be hidden in lower frequencies. But depending on how "busy" the audio chosen for hiding the information is, these painted frequencies need to have quite a high amplitude which will result in hearable noise.
The Minimal and Maximal Amplitude option would enable the user to "filter" for specific amplitude ranges, giving the possibility to "enhance" text painted with lower amplitudes in the mix.
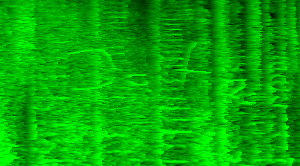
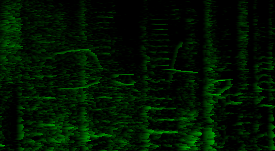
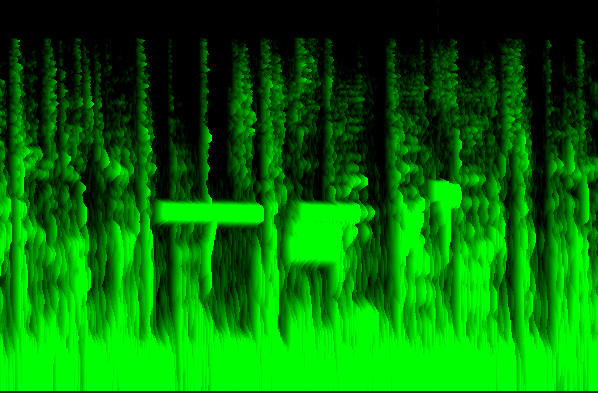
Example Images for the FFT-Size:
Around 300 samples:
Around 2500 samples:
Some Programs allow the selection of color schemes aswell:
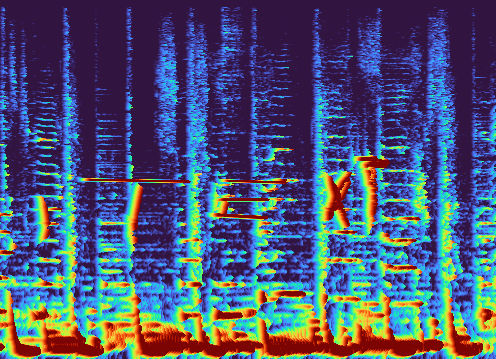
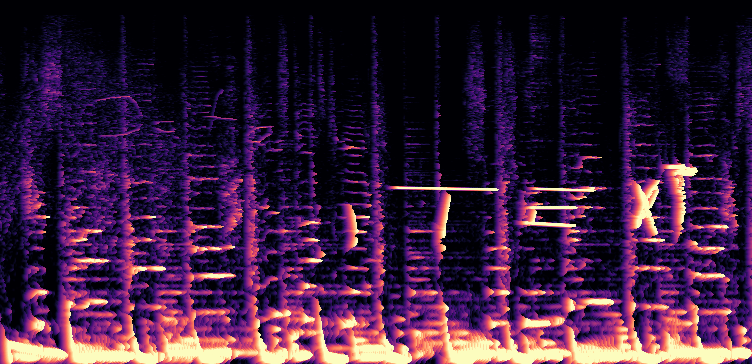
This wouldn't necessarily be a feature that should be implemented, but it shows that different amplitudes are displayed with different brightnesses, opacities or colors. In the previous images "brighter" was related to a greater frequency amplitude. The last image has a color scheme applied which displays low amplitudes as blue and high amplitudes red to white.
Contributor guide
Research direction
The issue names no files, tests, or entry points. Start by surveying CyberChef's existing operations and image-output handling, then clarify which audio formats, spectrum options, and output behavior are required. Done would mean a defined Spectrum Viewer operation that converts the selected audio data into a usable spectrum image.
Written by the indexing model from the issue text.
Assessment
- Tech stack
- javascript
- Domain
- data-visualization
- Issue type
- Feature
- Difficulty
- 5/5
- Estimated time
- Over a week
- Activity status
- Stale
- Clarity
- Needs clarification
- Newbie friendliness
- 25/100