firefox-devtools / firefox-devtools/vscode-firefox-debug
pathMappings don't work correctly with custom webRoot
- Dominant language
- TypeScript
- Stars
- 447
- Forks
- 76
- PR merge metrics
- No merged PRs in 30d
Description
Hello,
I have a repository that contains two different node.js projects managed by lerna on the root of it. Here is the tree output of the repository;
```
.
├── lerna.json
├── package.json
├── studio
│ ├── config
│ │ └── @sanity
│ │ ├── data-aspects.json
│ │ ├── default-layout.json
│ │ ├── default-login.json
│ │ └── form-builder.json
│ ├── package.json
│ ├── plugins
│ ├── README.md
│ ├── sanity.json
│ ├── schemas
│ │ ├── author.js
│ │ ├── blockContent.js
│ │ ├── category.js
│ │ ├── post.js
│ │ └── schema.js
│ ├── static
│ │ └── favicon.ico
│ ├── tsconfig.json
│ ├── versel.json
│ └── yarn.lock
└── web
├── interfaces
│ └── index.ts
├── lib
│ ├── api.ts
│ └── sanity.ts
├── LICENSE
├── next-env.d.ts
├── package.json
├── package-lock.json
├── pages
│ ├── about.tsx
│ ├── _app.tsx
│ ├── _document.tsx
│ └── index.tsx
├── public
│ └── logo.png
├── README.md
├── src
│ ├── AuthorBox.tsx
│ ├── Copyright.tsx
│ ├── HeroPost.tsx
│ ├── Layout.tsx
│ ├── Link.tsx
│ ├── Maintenance.tsx
│ ├── PostCard.tsx
│ ├── ProTip.tsx
│ └── theme.tsx
└── tsconfig.json
```
The problem occurs when I try to debug the `web` package. It's next.js application with TypeScript.
I've set `webRoot` to `${workspaceFolder}/web/` as the documentation suggests. At this point according to the documentation, default pathMappings should be added according to this webRoot. But instead, they don't.
After setting the `webRoot` and start the debugging process, the extension throws a question about missing pathMapping as soon as you want to set a breakpoint. Here is the screenshot of the question;
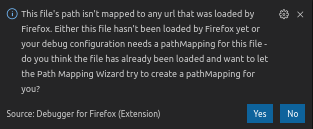
After accepting that question and restarting the debugger everything works at first sight. It catches all the breakpoints and pauses the process when hits them as expected.
But as soon as starting to run the program one or a few steps into (F11 shortcut) further, error messages start to appears.
Here are the example messages of missing source file errors;
```
Could not load source '_n_e/node_modules/@material-ui/core/esm/styles/index.js': Failed sourceRequest: the requested source can't be found.
```
After a few more steps I again get the error;
```
Could not load source '_n_e/node_modules/@material-ui/core/esm/styles/makeStyles.js': Failed sourceRequest: the requested source can't be found.
```
This error occurs when the step is on source codes from the `node_modules` and `.next` folder.
This is my VSCode debugging configuration. I've marked the section added after accepting the auto-mapping question. There is clearly something wrong here;
```json
{
// Use IntelliSense to learn about possible attributes.
// Hover to view descriptions of existing attributes.
// For more information, visit: https://go.microsoft.com/fwlink/?linkid=830387
"version": "0.2.0",
"configurations": [
{
"type": "firefox",
"request": "launch",
"name": "Next: Firefox",
"url": "http://localhost:3000",
"webRoot": "${workspaceFolder}/web/",
// This pathMappings has added after question accepted
"pathMappings": [
{
"url": "webpack://_n_e/src",
"path": "${workspaceFolder}/web/src"
}
]
},
{
"type": "node",
"request": "launch",
"name": "Next: Node",
"runtimeExecutable": "npm",
"args": [
"run",
"debug"
],
"port": 9229,
"console": "integratedTerminal",
"cwd": "${workspaceFolder}/web/"
}
],
"compounds": [
{
"name": "Next: Full",
"configurations": ["Next: Node", "Next: Firefox"]
}
]
}
```
Contributor guide
Assessment
This issue has not been assessed yet.