firefox-devtools / firefox-devtools/profiler
Display "paused ranges" in the UI
- Dominant language
- TypeScript
- Stars
- 1.5k
- Forks
- 491
- Avg merge
- 3d 46m
- Merged PRs (30d)
- 27
Description
See this profile: https://perfht.ml/2nfAMA3
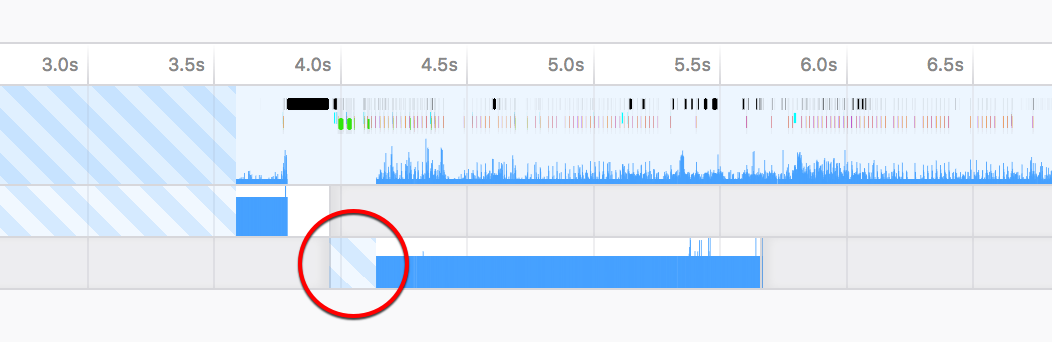
The striped area that I circled in red should not be there - we don't expect to have any data in that range.
This thread was starting while the profiler was paused. During that time, we don't capture any samples. These time ranges are listed in the `pausedRanges` field on the process / thread. We should take those ranges into account when computing the time at which we expect to start having samples. (And ideally, we should also mark those ranges visually, but that can be done in a separate step.)
┆Issue is synchronized with this [Jira Task](https://mozilla-hub.atlassian.net/browse/FP-694)
Contributor guide
Assessment
This issue has not been assessed yet.