firefox-devtools / firefox-devtools/profiler
Handle unsymbolicated JIT frames
- Dominant language
- TypeScript
- Stars
- 1.5k
- Forks
- 491
- Avg merge
- 3d 5h
- Merged PRs (30d)
- 30
Description
Edit: This issue is now tracking work in https://bugzilla.mozilla.org/show_bug.cgi?id=1426124
- - -
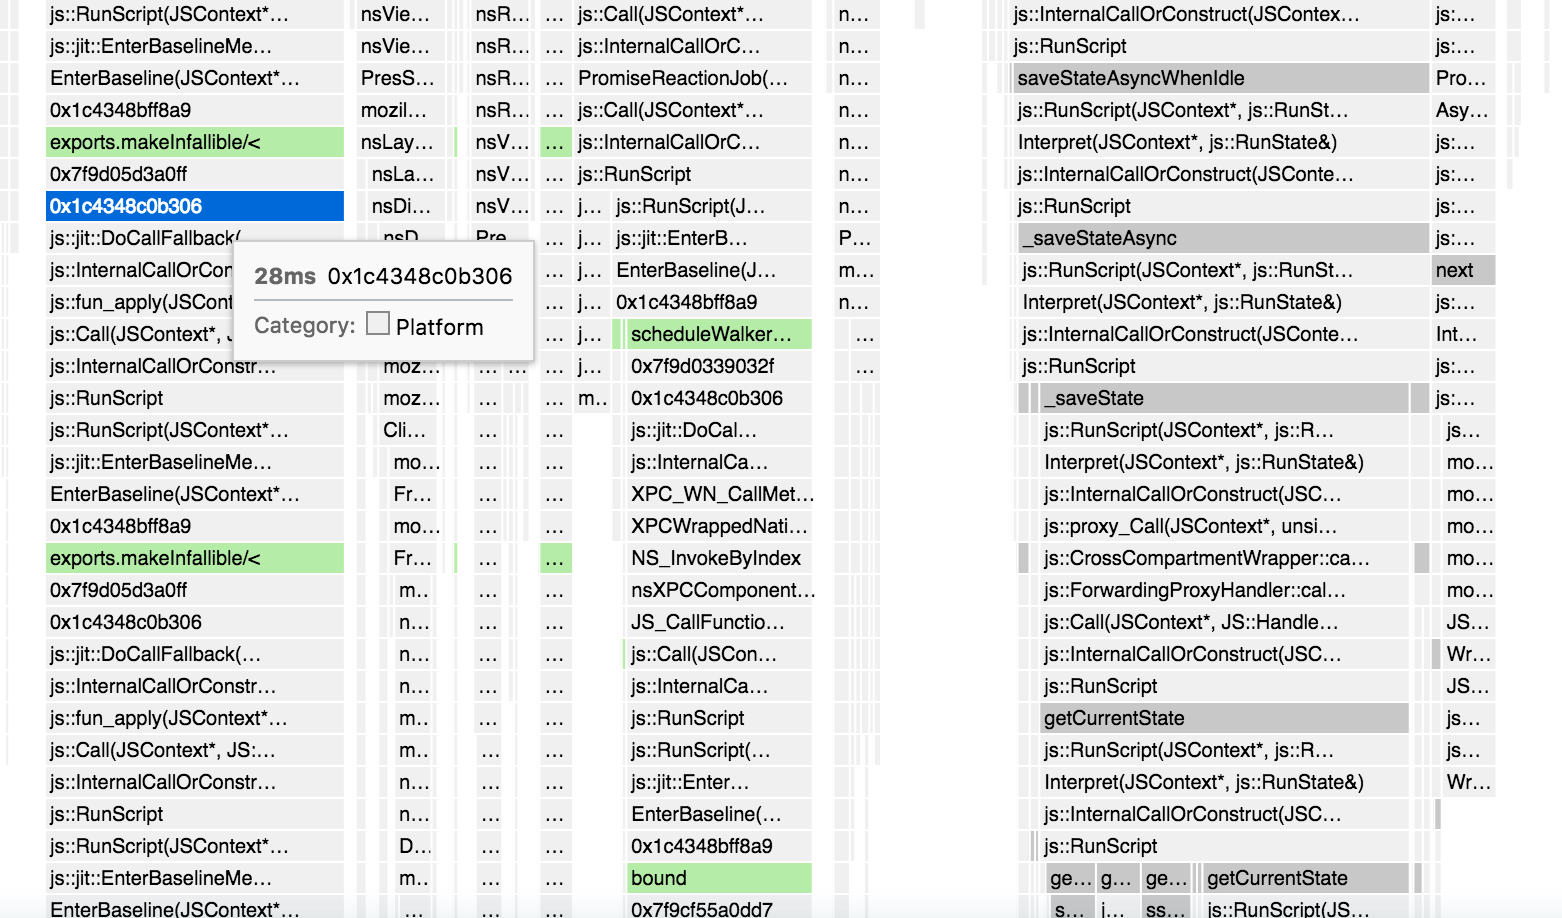
JIT frames are usually followed by a few frames of unsymbolicated memory. This is confusing our users as can be seen by https://bugzilla.mozilla.org/show_bug.cgi?id=1397718. There is there any value in keeping these frames here? I see two clear ways to deal with them.
## Option 1: Process them out
I'm not sure the frames give us any real useful information in of themselves. I would be in favor of stripping them out from the profiles in a processing step. We can correctly identify by merging any stacks directly following a JS JIT stack.
## Option 2: Label them as JIT frames
If there is something useful about keeping them around then we should at least add some kind of knowledge about them to the processed profile format, then display them as "(generated JIT code)" or something like that. I don't think there is any utility in showing the raw memory addresses.
┆Issue is synchronized with this [Jira Task](https://mozilla-hub.atlassian.net/browse/FP-669)
Contributor guide
Assessment
This issue has not been assessed yet.