firefox-devtools / firefox-devtools/profiler
Misleading times displayed in the flame graph, should show number of samples instead
- Dominant language
- TypeScript
- Stars
- 1.5k
- Forks
- 491
- Avg merge
- 3d 46m
- Merged PRs (30d)
- 27
Description
Profile: https://share.firefox.dev/341Msw7
This is a profile where the profiler was not able to obtain a lot of samples.
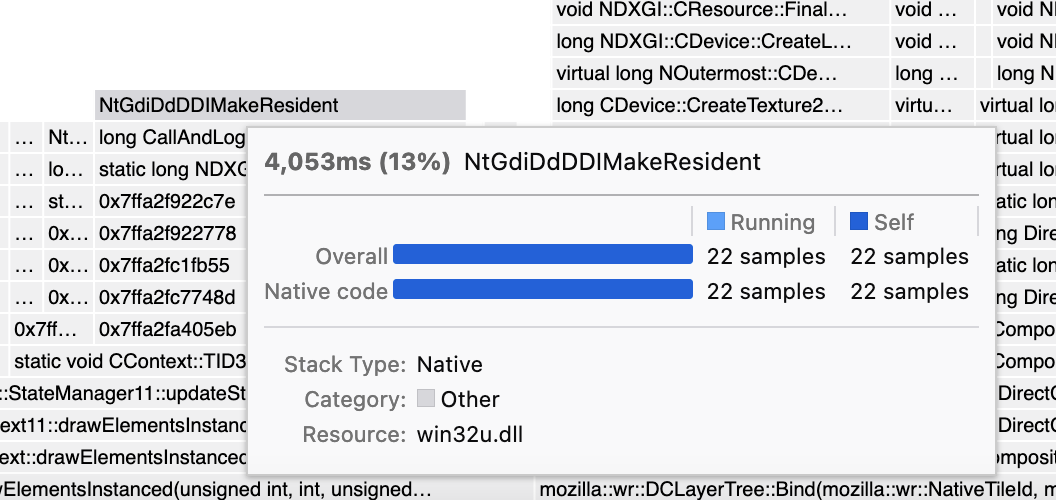
When hovering over boxes in the flame graph, I see some very large times displayed. It seems these times are computed by multiplying the sample percentage with the duration of the selected range? That's rather misleading. Let's display the raw sample counts instead.
Steps to reproduce:
1. Load the profile. https://share.firefox.dev/341Msw7
1. Hover the function NtGdiDdDDIMakeResident (in the middle at the top).
Expected results:
The tooltip should display "22 samples (13%)", just as in the call tree.
Actual results:
The tooltip displays "4,053ms (13ms)".
┆Issue is synchronized with this [Jira Task](https://mozilla-hub.atlassian.net/browse/FP-328)
Contributor guide
Assessment
This issue has not been assessed yet.