firefox-devtools / firefox-devtools/profiler
Case study: toLocaleString
- Dominant language
- TypeScript
- Stars
- 1.5k
- Forks
- 491
- Avg merge
- 3d 5h
- Merged PRs (30d)
- 30
Description
[This profile](https://profiler.firefox.com/public/75410f84f200ec56a1be8716a44b87d4cee111d6/stack-chart/?ctSummary=native-allocations&globalTrackOrder=0-1-2-3-4-5&hiddenGlobalTracks=1-2-3-4-5&hiddenLocalTracksByPid=79573-0&implementation=js&localTrackOrderByPid=79573-1-0~79574-0~79578-0~80085-0~79632-0~79576-0~&profileName=toLocaleTimeString%28%29%20-%20memory&thread=0&v=5) would make a great case study at looking at how memory allocation can cause issues:
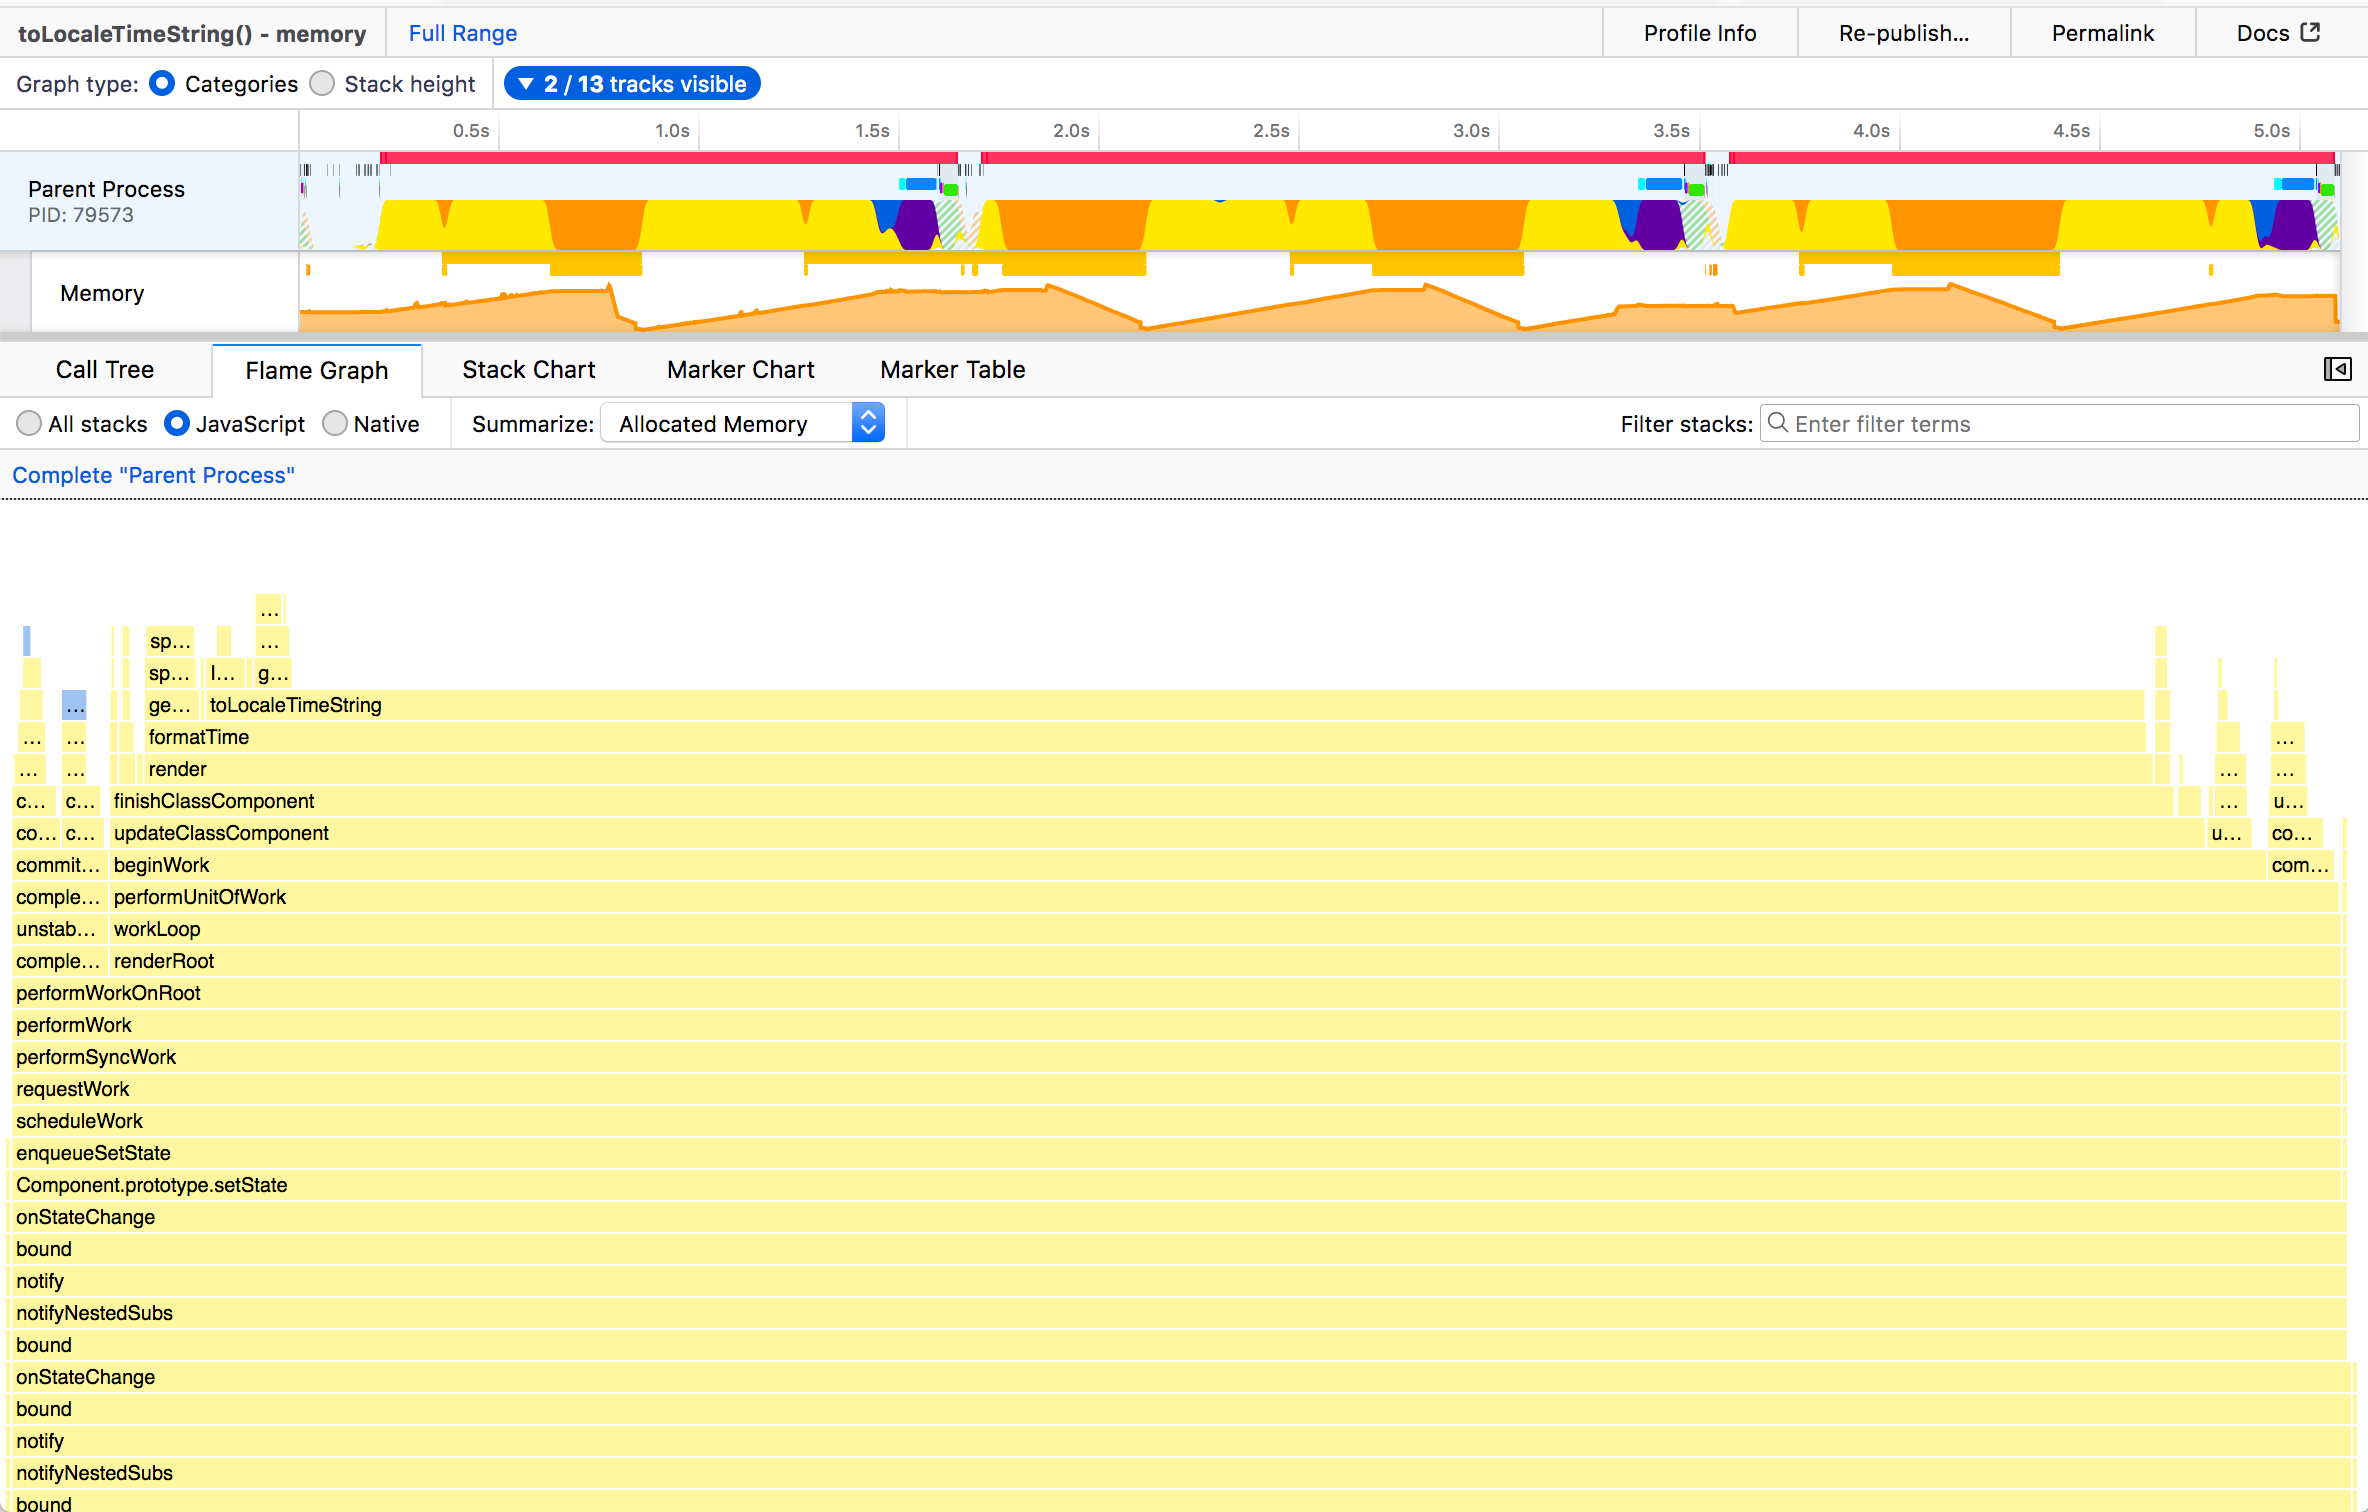
This was in the netmonitor. It would be good to dig up the Bug # as well.
┆Issue is synchronized with this [Jira Task](https://mozilla-hub.atlassian.net/browse/FP-313)
Contributor guide
Assessment
This issue has not been assessed yet.