firefox-devtools / firefox-devtools/profiler
Feature request: Show # of units of garbage, rather than/in addition to the number of bytes of garbage
- Dominant language
- TypeScript
- Stars
- 1.5k
- Forks
- 491
- Avg merge
- 3d 5h
- Merged PRs (30d)
- 30
Description
When profiling JS garbage in my Wasm program with the new performance profiler in Nightly, I get
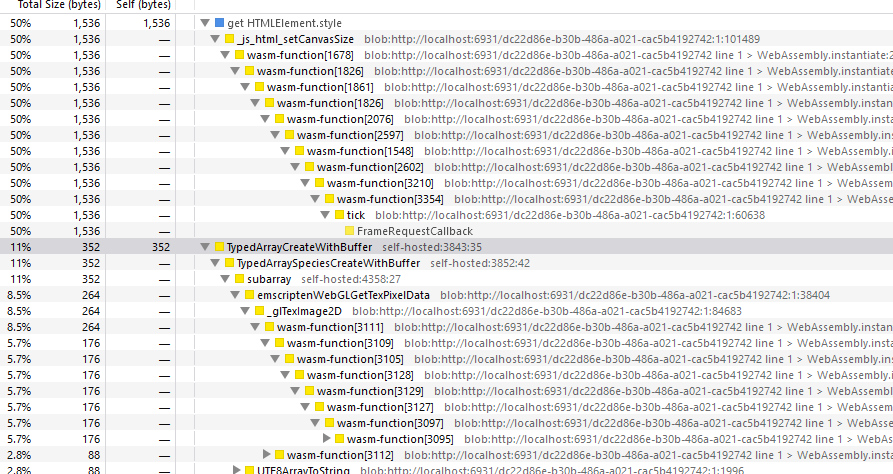
I think it is more interesting (generally) to observe "runaway" allocations that repeat often, rather than the # of bytes allocated. (That is, at least, when the # of bytes allocated are comparable and not in hundreds of megs).
For example in the above image, I'd like to know how many times allocations were done for each. The function `js_html_setCanvasSize` is called exactly once, but the function `emscriptenWebGLGetTexPixelData` is actually a recurring temp allocation that occurs often in the program. So I'd like to sort by # of items allocated, rather than their size. Would that be possible to add?
┆Issue is synchronized with this [Jira Task](https://mozilla-hub.atlassian.net/browse/FP-223)
Contributor guide
Assessment
This issue has not been assessed yet.