firefox-devtools / firefox-devtools/profiler
Missing fill in network bar in this profile (unexpected opacity:0)
Open
network panel
- Dominant language
- TypeScript
- Stars
- 1.5k
- Forks
- 491
- Avg merge
- 3d 46m
- Merged PRs (30d)
- 27
Description
Profile: https://perfht.ml/2OOFgfI
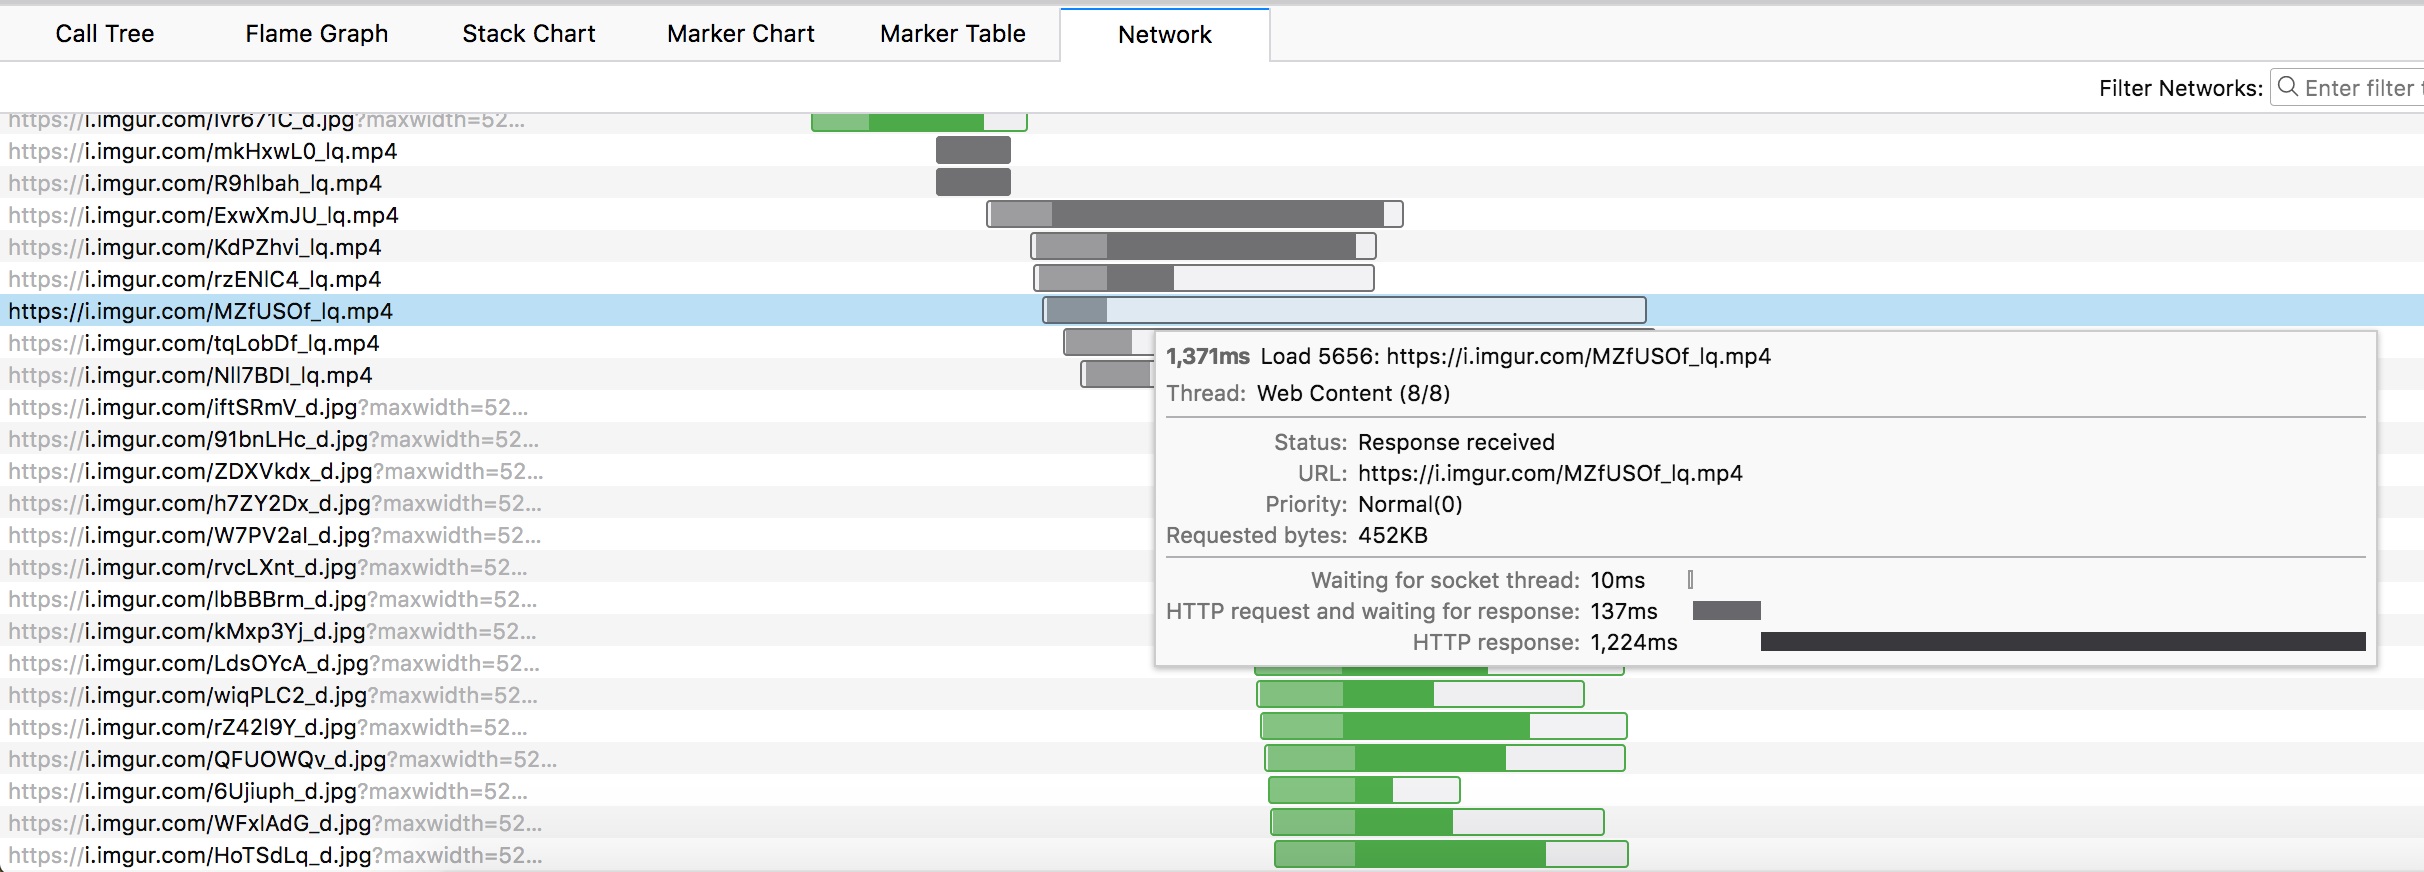
For this network request, the tooltip shows a long time spent in "HTTP Response", but in the bar that time is empty instead of filled with opaque dark gray. Emptiness usually indicates that the request has finished but it's waiting in some event loop. This seems contradictory.
┆Issue is synchronized with this [Jira Task](https://mozilla-hub.atlassian.net/browse/FP-209)
Contributor guide
Assessment
This issue has not been assessed yet.