firefox-devtools / firefox-devtools/profiler
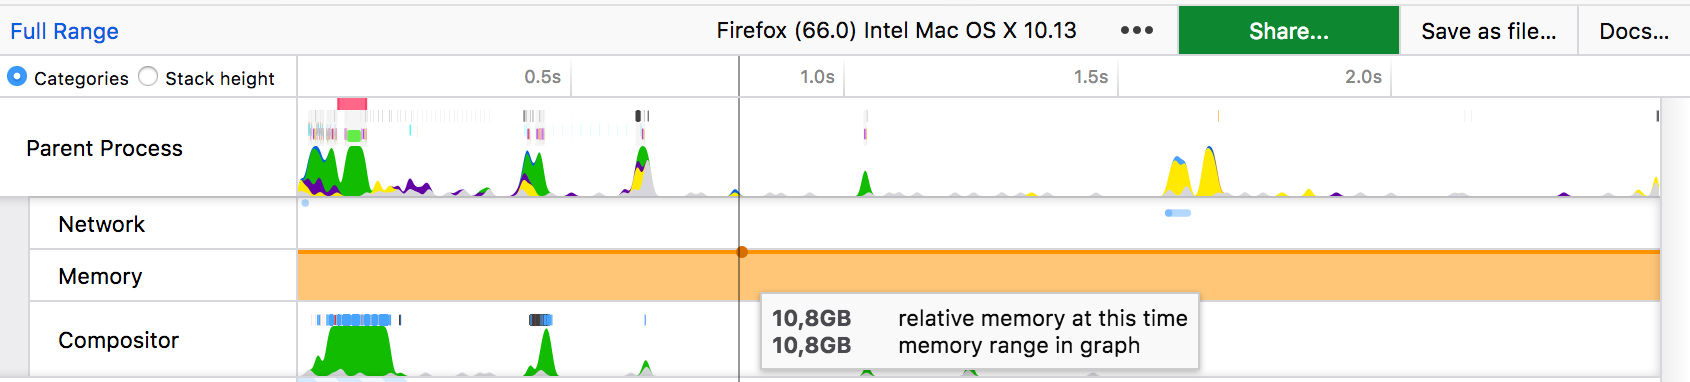
"memory range in graph" is incorrect and memory tracks look flat
Open
memory
- Dominant language
- TypeScript
- Stars
- 1.5k
- Forks
- 491
- Avg merge
- 3d 46m
- Merged PRs (30d)
- 27
Description
This happens when capturing a profile after restarting the profiler, but we may have a similar problem when the profiler has been running for so long that we no longer have the beginning of the buffer.
┆Issue is synchronized with this [Jira Task](https://mozilla-hub.atlassian.net/browse/FP-112)
Contributor guide
Assessment
This issue has not been assessed yet.