Extra allocations makes short range queries 5% slower when linked with glibc malloc
- Dominant language
- C++
- Stars
- 32.1k
- Forks
- 6.9k
- Avg merge
- 32m
- Merged PRs (30d)
- 1
Description
I encountered this by accident when doing benchmarks and using glibc malloc by accident. Normally I use jemalloc, but it wasn't installed on the host on which I compiled db_bench. This is introduced by https://github.com/facebook/rocksdb/commit/8b74cea7fec704cf67a168fef9e452ede56f1974 and the new allocation might [be here](https://github.com/facebook/rocksdb/commit/8b74cea7fec704cf67a168fef9e452ede56f1974#diff-fa4d0a70a442f1bb084473073e13f618e1dc8b718fdb9c7e3536f7a243a63310R399).
I know we prefer jemalloc vs glibc malloc, but is it possible to reduce the amount of allocations?
Example output from the fwdrangewhilewriting benchmark step shows the impact. QPS drops from 512323 to 485274. The first line is from b82edffc7b and the second is from 8b74cea7fe. These diffs are adjacent in the repo (b82... precedes 8b7...).
```
ops_sec mb_sec lsm_sz blob_sz c_wgb w_amp c_mbps c_wsecs c_csecs b_rgb b_wgb usec_op p50 p99 p99.9 p99.99 pmax uptime stall% Nstall u_cpu s_cpu rss test date version job_id githash
512323 2052.1 18GB 0.0GB, 33.3 14.9 28.8 107 75 0 0 42.9 41.7 76 168 479 22597 1183 0.0 0 21.2 3.1 0.0 fwdrangewhilewriting.t22 2022-07-11T18:36:10 7.3.0 b82edffc7b
485274 1943.7 18GB 0.0GB, 33.2 14.8 28.7 106 74 0 0 45.3 43.7 84 174 489 22534 1183 0.0 0 21.8 2.8 0.0 fwdrangewhilewriting.t22 2022-07-11T18:57:20 7.3.0 8b74cea7fe
```
From the throughput result and vmstat output (not shared here) I see that 8b74cea7fe uses ~5% more CPU per query. I confirmed this does not reproduce when db_bench is linked with jemalloc.
A reproduction script:
```
numactl --interleave=all ./db_bench --benchmarks=fillseq --allow_concurrent_memtable_write=false --level0_file_num_compaction_trigger=4 --level0_slowdown_writes_trigger=20 --level0_stop_writes_trigger=30 --max_background_jobs=8 --max_write_buffer_number=8 --db=/data/m/rx --wal_dir=/data/m/rx --num=40000000 --key_size=20 --value_size=400 --block_size=8192 --cache_size=193273528320 --cache_numshardbits=6 --compression_max_dict_bytes=0 --compression_ratio=0.5 --compression_type=none --bytes_per_sync=8388608 --cache_index_and_filter_blocks=1 --cache_high_pri_pool_ratio=0.5 --benchmark_write_rate_limit=0 --write_buffer_size=16777216 --target_file_size_base=16777216 --max_bytes_for_level_base=67108864 --verify_checksum=1 --delete_obsolete_files_period_micros=62914560 --max_bytes_for_level_multiplier=8 --statistics=0 --stats_per_interval=1 --stats_interval_seconds=20 --report_interval_seconds=5 --histogram=1 --memtablerep=skip_list --bloom_bits=10 --open_files=-1 --subcompactions=1 --compaction_style=0 --num_levels=8 --min_level_to_compress=3 --level_compaction_dynamic_level_bytes=true --pin_l0_filter_and_index_blocks_in_cache=1 --min_level_to_compress=0 --use_existing_db=0 --sync=0 --threads=1 --memtablerep=vector --allow_concurrent_memtable_write=false --disable_wal=1 --seed=1657564500 --report_file=benchmark_fillseq.wal_disabled.v400.log.r.csv 2>&1
numactl --interleave=all timeout 1800 ./db_bench --benchmarks=seekrandomwhilewriting --use_existing_db=1 --sync=0 --level0_file_num_compaction_trigger=4 --level0_slowdown_writes_trigger=20 --level0_stop_writes_trigger=30 --max_background_jobs=8 --max_write_buffer_number=8 --db=/data/m/rx --wal_dir=/data/m/rx --num=40000000 --key_size=20 --value_size=400 --block_size=8192 --cache_size=193273528320 --cache_numshardbits=6 --compression_max_dict_bytes=0 --compression_ratio=0.5 --compression_type=none --bytes_per_sync=8388608 --cache_index_and_filter_blocks=1 --cache_high_pri_pool_ratio=0.5 --benchmark_write_rate_limit=2097152 --write_buffer_size=16777216 --target_file_size_base=16777216 --max_bytes_for_level_base=67108864 --verify_checksum=1 --delete_obsolete_files_period_micros=62914560 --max_bytes_for_level_multiplier=8 --statistics=0 --stats_per_interval=1 --stats_interval_seconds=20 --report_interval_seconds=5 --histogram=1 --memtablerep=skip_list --bloom_bits=10 --open_files=-1 --subcompactions=1 --compaction_style=0 --num_levels=8 --min_level_to_compress=3 --level_compaction_dynamic_level_bytes=true --pin_l0_filter_and_index_blocks_in_cache=1 --duration=1200 --threads=22 --merge_operator="put" --seek_nexts=10 --reverse_iterator=false --seed=1657564570 --report_file=benchmark_fwdrangewhilewriting.t22.log.r.csv 2>&1
```
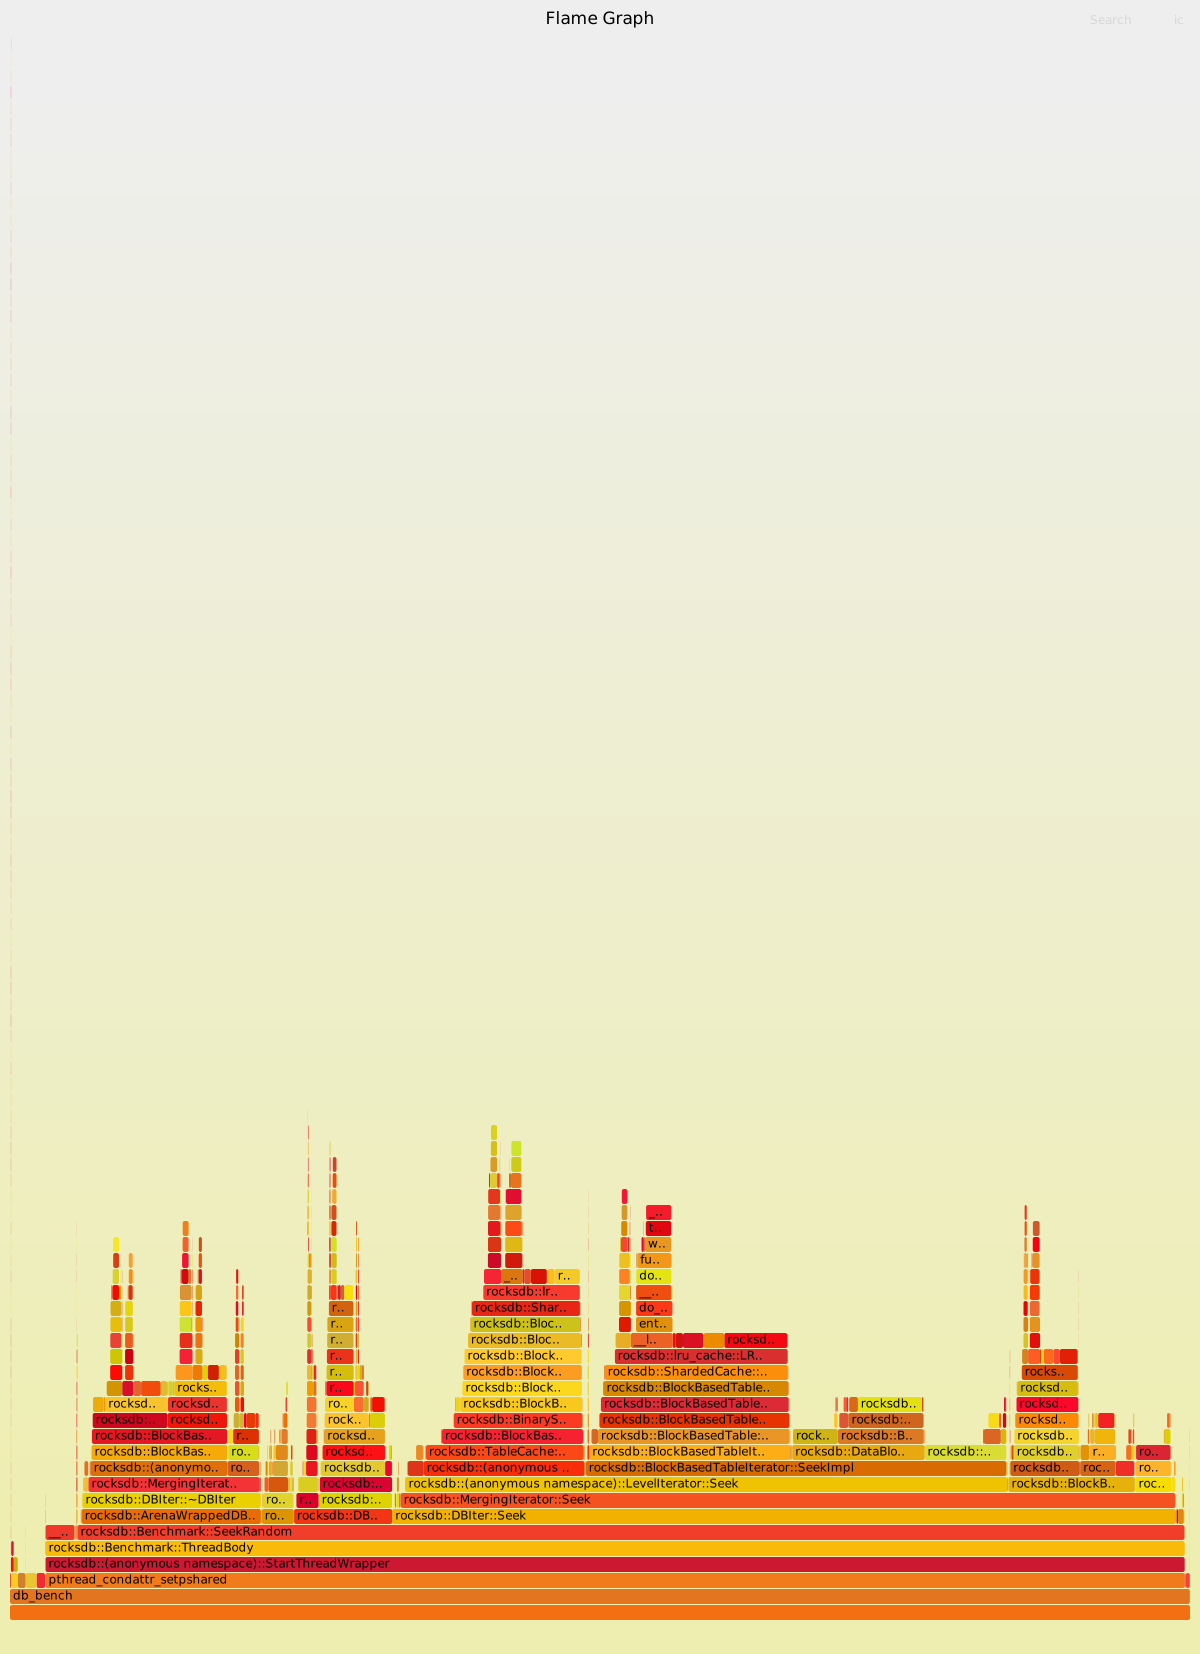
A flamegraph for b82edffc7b (no regression here)
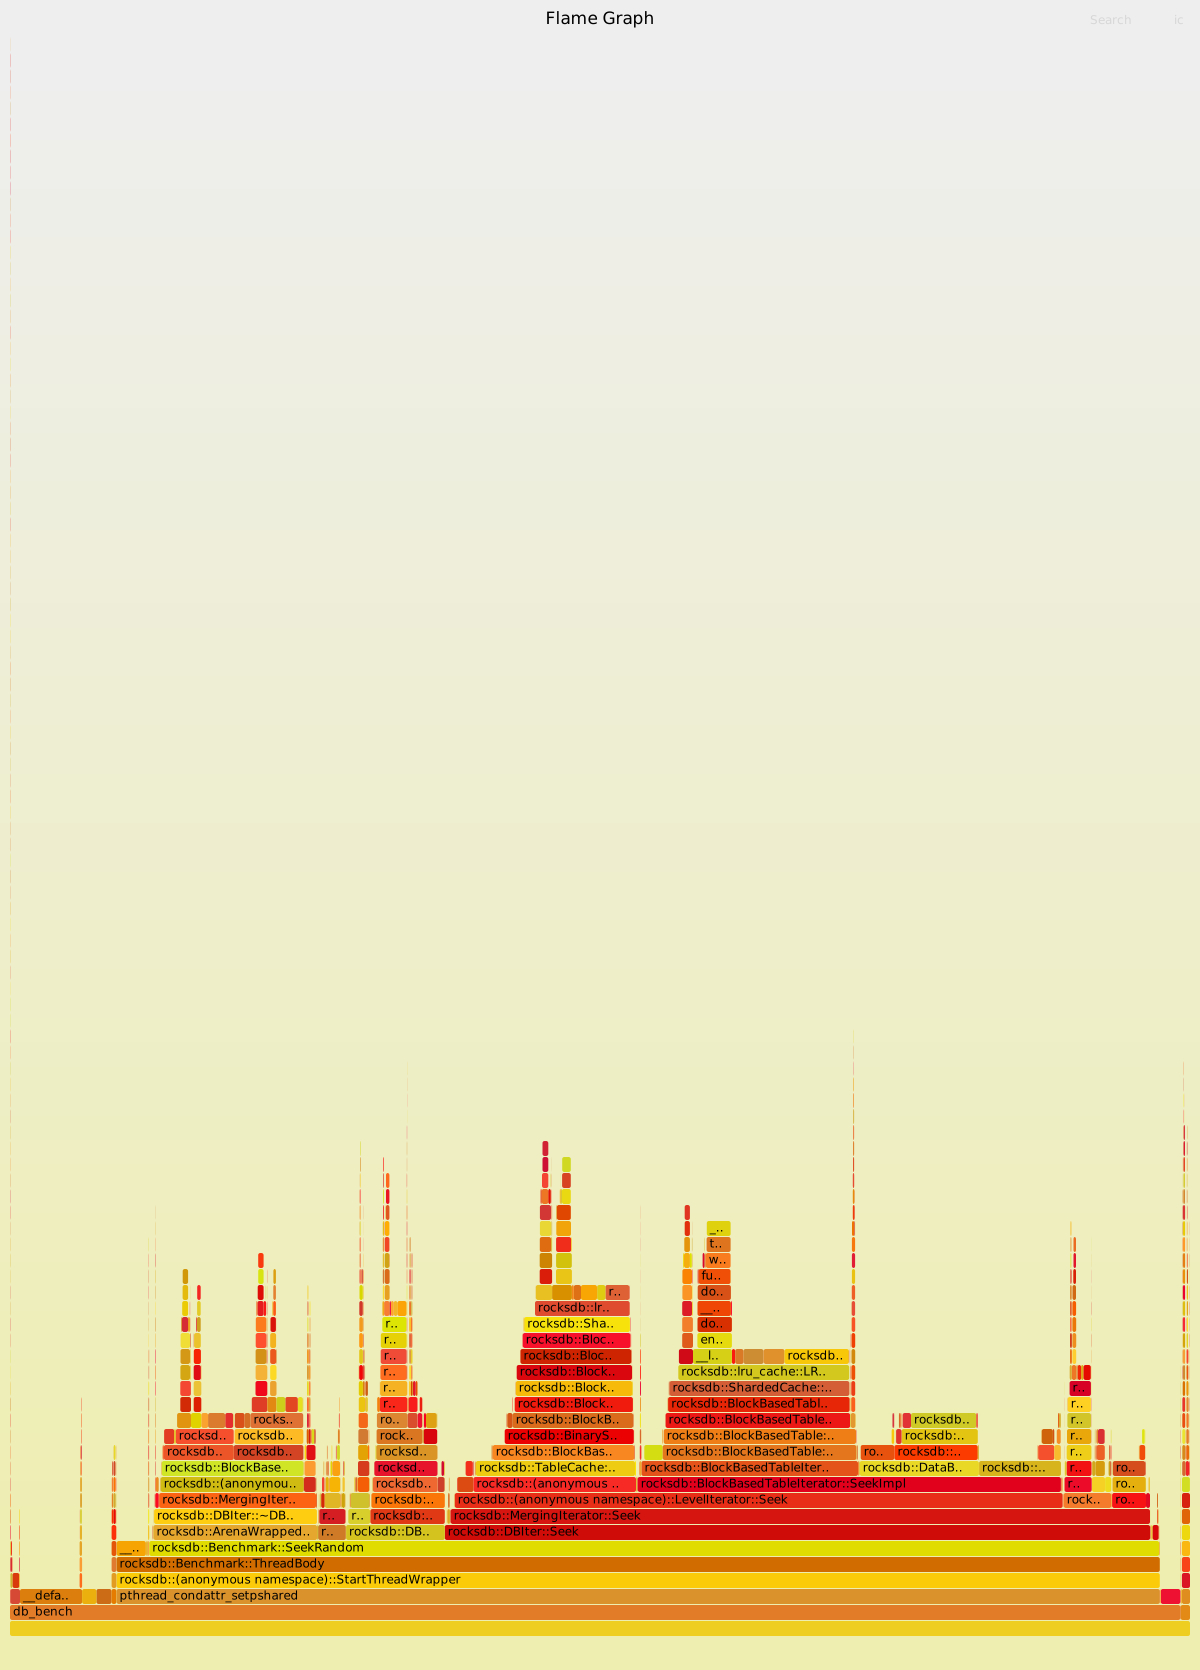
A flamegraph for 8b74cea7fe that shows the problem -- on the left side of the flamegraph the call stacks for __default_morecore, __libc_free and __libc_malloc are much wider:
Contributor guide
Assessment
This issue has not been assessed yet.