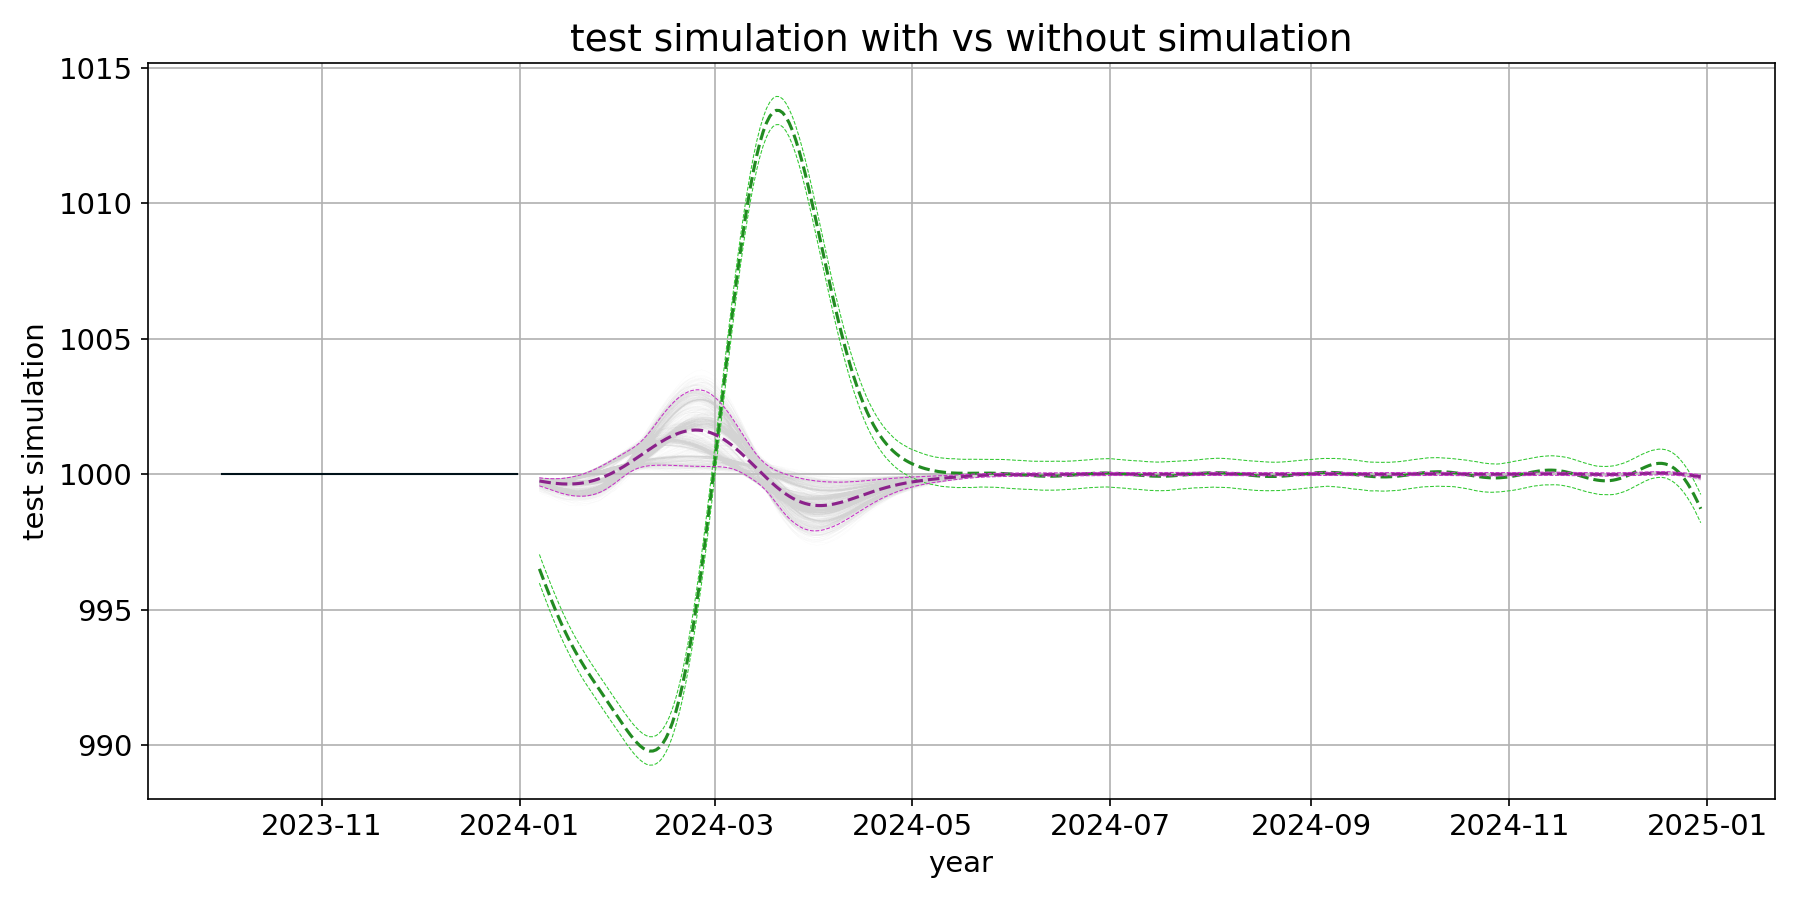
Forecast-Interval: MCMC simulation results are shifted compared to non-MCMC results
- Dominant language
- Python
- Stars
- 20.4k
- Forks
- 4.6k
- Avg merge
- 19h 52m
- Merged PRs (30d)
- 1
Description
Forecast-Interval: MCMC simulation results are shifted compared to non-MCMC results
Here's a replicable code. Using prophet `pip install --upgrade --force-reinstall --no-cache prophet==1.0.1`
# **RESULTS:**
Green ones are the
Here's the demo data

Here's the results:
# **CODE:**
## Step 1 get the demo data
```
import numpy as np
import pandas as pd
import matplotlib.pyplot as plt
# Parameters
num_days = 365
growth_rate = 0.1
carrying_capacity = 1000
weekly_amplitude = 50
# Time indices
time_indices = np.arange(num_days)
# Logistic growth function
def logistic_growth(t, r, K):
return K / (1 + (K - 1) * np.exp(-r * t))
# Weekly seasonality function
def weekly_seasonality(t, amplitude):
return amplitude * np.sin(2 * np.pi * t / 7)
# Generate time series data
trend = logistic_growth(time_indices, growth_rate, carrying_capacity)
seasonality = weekly_seasonality(time_indices, weekly_amplitude)
time_series = trend + seasonality
# Create a DataFrame with dates and values
dates = pd.date_range(start='2023-01-01', periods=num_days, freq='D')
data = pd.DataFrame({'date': dates, 'value': time_series})
# Extend the DataFrame for 365 more days
additional_dates = pd.date_range(start='2024-01-01', periods=365, freq='D')
additional_data = pd.DataFrame({'date': additional_dates, 'value': np.nan})
# Concatenate the two DataFrames
data = pd.concat([data, additional_data], ignore_index=True)
# Plot the time series
plt.figure(figsize=(10, 6))
plt.plot(data['date'], data['value'], label='Logistic Trend with Weekly Seasonality')
plt.xlabel('date')
plt.ylabel('value')
plt.legend()
plt.show()
plt.savefig(f'demo data.png', dpi=150)
data['cap'] = 1000
data['floor'] = 0
data
```
## Step 2, Get Prophet set up
```
from pandas import DataFrame
from prophet import Prophet
PROPHET_OPTIMIZATION_ITER = 500
def prophet_simulation(
train: DataFrame,
args: dict,
hyperparams: dict
) -> DataFrame:
train_ts_col = args["train_timestamp_col"]
train_val_col = args["train_value_col"]
cap_ts_col = args["cap_timestamp_col"]
cap_val_col = args["cap_value_col"]
floor_ts_col = args["floor_timestamp_col"]
floor_val_col = args["floor_value_col"]
reg_ts_col = args["reg_timestamp_col"]
reg_val_cols = args["reg_value_col"]
time_freq = args["time_freq"]
cols = {train_ts_col: "ds", train_val_col: "y"}
# create capacity if provided
if cap_ts_col:
cols[cap_val_col] = "cap"
cap = train[[cap_ts_col, cap_val_col]]
cap.rename(columns={cap_ts_col: "ds", cap_val_col: "cap"}, inplace=True)
# create floor if provided
if floor_ts_col:
cols[floor_val_col] = "floor"
floor = train[[floor_ts_col, floor_val_col]]
floor.rename(
columns={floor_ts_col: "ds", floor_val_col: "floor"}, inplace=True
)
# create regressors if provided
if reg_ts_col:
for reg_col in reg_val_cols:
cols[reg_col] = reg_col
reg = train[[reg_ts_col] + reg_val_cols]
reg.rename(columns={reg_ts_col: "ds"}, inplace=True)
ts = train[cols.keys()]
last_ix = ts[train_val_col].last_valid_index()
ts = ts[ts.index <= last_ix]
ts.rename(columns=cols, inplace=True)
# initialize prophet
optimization_algo = hyperparams.pop("optimization_algo", None)
optimization_iter = hyperparams.pop("optimization_iter", None)
# by default we don't want Newton fallback because it's too slow
# and makes the jobs stuck and fail in some cases
# but this can always be overridden by user
newton_fallback = hyperparams.pop("newton_fallback", False)
hyperparams['interval_width'] = 0.9
model = Prophet(**hyperparams)
# add regressors if provided
if reg_ts_col:
for col in reg.columns.drop("ds"):
model.add_regressor(
col, prior_scale=None, standardize="auto", mode=None
)
# fit prophet
model.stan_backend.set_options(newton_fallback=newton_fallback)
kwargs = {}
if optimization_algo:
kwargs["algorithm"] = optimization_algo
if optimization_iter:
kwargs["iter"] = optimization_iter
else:
# by default, we cap the number of iterations to 500 to cater for
# slow convergence, performance issues and job failures.
# but this can always be overridden by user
kwargs["iter"] = PROPHET_OPTIMIZATION_ITER
model.fit(ts, **kwargs)
# make data frame with future dates
forecast_len = args["forecast_length"]
future = model.make_future_dataframe(periods=forecast_len, freq=time_freq)
# merge capacity if provided
if cap_ts_col:
future = future.merge(cap, how="left", on="ds")
# merge floor if provided
if floor_ts_col:
future = future.merge(floor, how="left", on="ds")
# merge regressors if provided
if reg_ts_col:
future = future.merge(reg, how="left", on="ds")
# run forecast
actual_forecast = model.predict(future)
forecast = actual_forecast[
["ds", "yhat", "yhat_lower", "yhat_upper"]
]
forecast = forecast.iloc[-forecast_len:]
forecast["yhat"] = np.where(forecast["yhat"] < 0, 0, forecast["yhat"])
forecast["yhat_lower"] = np.where(
forecast["yhat_lower"] < 0,
0,
forecast["yhat_lower"],
)
forecast.rename(
columns={
"ds": train_ts_col,
"yhat": train_val_col,
"yhat_lower": f"{train_val_col}_lower",
"yhat_upper": f"{train_val_col}_upper",
},
inplace=True,
)
if input_hp["mcmc_samples"] > 0:
sim_predictive_samples = model.predictive_samples(future)
df_simulated_yhat = pd.DataFrame(sim_predictive_samples['yhat']).iloc[-forecast_len:]
df_simulated_trend = pd.DataFrame(sim_predictive_samples['trend']).iloc[-forecast_len:]
df_simulated_yhat.columns = [f'S_yhat_{i:04d}' for i in range(1, 1001)]
df_simulated_trend.columns = [f'S_tr_{i:04d}' for i in range(1, 1001)]
return forecast, model, sim_predictive_samples, actual_forecast
else:
return forecast, model
```
## Step 3, Hyperparam and Arguments
```
input_hp = {'changepoint_prior_scale': 0.05, 'changepoint_range': 0.8, 'growth': 'logistic', 'seasonality_mode': 'additive', 'seasonality_prior_scale': 0.01, 'yearly_seasonality': True}
input_arg = {'forecast_length': 365,
'train_timestamp_col': "date",
'train_value_col': "value",
'reg_timestamp_col': None,
'reg_value_col': None,
"cap_timestamp_col": "date",
"cap_value_col": "cap",
"floor_timestamp_col": 'date',
"floor_value_col": "floor",
'time_freq': "d"}
```
## Step 4, Run 2 versions, with and without MCMC
```
input_hp["mcmc_samples"] = 300
forecast_mcmc, model_mcmc, sim_predictive_samples, actual_forecast = prophet_simulation(
train = data,
args=input_arg,
hyperparams = input_hp
)
input_hp["mcmc_samples"] = 0
forecast, model = prophet_simulation(
train = data,
args=input_arg,
hyperparams = input_hp
)
```
## Step 5, Compare output
```
df_simulated_yhat = pd.DataFrame(sim_predictive_samples['yhat']).iloc[-365:]
df_simulated_trend = pd.DataFrame(sim_predictive_samples['trend']).iloc[-365:]
df_simulated_yhat.columns = [f'S_yhat_{i:04d}' for i in range(1, 1001)]
df_simulated_trend.columns = [f'S_tr_{i:04d}' for i in range(1, 1001)]
df_out_act_ = data[['date', 'value']].dropna().reset_index(drop = True)
forecast_mcmc.columns = ['date', 'forecast_MCMC', 'lower_MCMC', 'upper_MCMC']
forecast.columns = ['date', 'forecast', 'lower', 'upper']
df_simulated_yhat['date'] = forecast_mcmc['date']
df_simulated_trend['date'] = forecast_mcmc['date']
# Actual-Forecast-Simulation (AFS)
df_afs = pd.merge(pd.merge(pd.merge(df_out_act_,
forecast, # forecast_mcmc
on = 'date',
how = 'outer'),
forecast_mcmc,
on = 'date', how = 'outer'
),
df_simulated_yhat,
on = 'date', how = 'outer'
)
df_afs
columns_to_plot = ['value', 'forecast', 'lower', 'upper', 'forecast_MCMC', 'lower_MCMC', 'upper_MCMC']
sim_columns_to_plot = [f'S_yhat_{i:04d}' for i in range(1, 1001)]
df_one_country_ = df_afs
df_one_country_ = df_one_country_.rolling(7).apply(lambda x : np.nanmean(x))
df_one_country_['date'] = df_afs['date']
df_one_country_ = df_one_country_[df_one_country_['date'] >= '2023-10-01'].reset_index(drop = True)
plt.rcParams.update({'figure.figsize': (12, 6), 'figure.dpi': 150,
'axes.labelsize': 14,'axes.titlesize':18, 'legend.fontsize': 14, 'xtick.labelsize': 14, 'ytick.labelsize': 14})
fig, ax = plt.subplots()
for ser in sim_columns_to_plot + columns_to_plot:
df_fil = df_one_country_[['date', ser]]
lstyle = '-' if ('value' in ser) else '--'
if ser in sim_columns_to_plot:
this_colour = 'lightgrey'
lstyle = "dotted"
linewidth = 0.05
elif ser == 'value':
this_colour = '#001219'
linewidth = 1
elif ser == 'forecast':
this_colour = '#228B22'
linewidth = 1.5
elif (ser == 'lower') | (ser == 'upper'):
this_colour = '#31C831'
linewidth = 0.5
elif ser == 'forecast_MCMC':
this_colour = '#8b228b'
linewidth = 1.5
elif (ser == 'lower_MCMC') | (ser == 'upper_MCMC'):
this_colour = '#c831c8'
linewidth = 0.5
else:
this_colour = '#D8D8D8'
lstyle = "dotted"
linewidth = 0.05
ax.plot(df_fil['date'], df_fil[ser],
label=ser, linewidth=linewidth, linestyle=lstyle, color = this_colour)
ax.xaxis.label.set_size(14)
ax.yaxis.label.set_size(14)
ax.set_ylabel('test simulation', fontsize=14)
ax.set_xlabel('year', fontsize=14)
# ax.legend(loc='upper left')
ax.grid()
ax.set_title('test simulation with vs without simulation')
fig.tight_layout()
fig.show()
plt.savefig(f'test simulation with vs without simulation.png', dpi=150)
plt.close()
``
Contributor guide
Assessment
This issue has not been assessed yet.