Model isn’t capturing seasonality spikes
- Dominant language
- Python
- Stars
- 20.4k
- Forks
- 4.6k
- Avg merge
- 19h 52m
- Merged PRs (30d)
- 1
Description
I’m trying to forecast data of a school's total student dropout by classes. Where each class has few data points along their period in the school. Each data point represents the total number of dropouts thus far in that class.
I assigned a fictive date to each class data point so every class is like a chronological period in a timeseries.
I added a seasonal period that is the number of data points of each class.
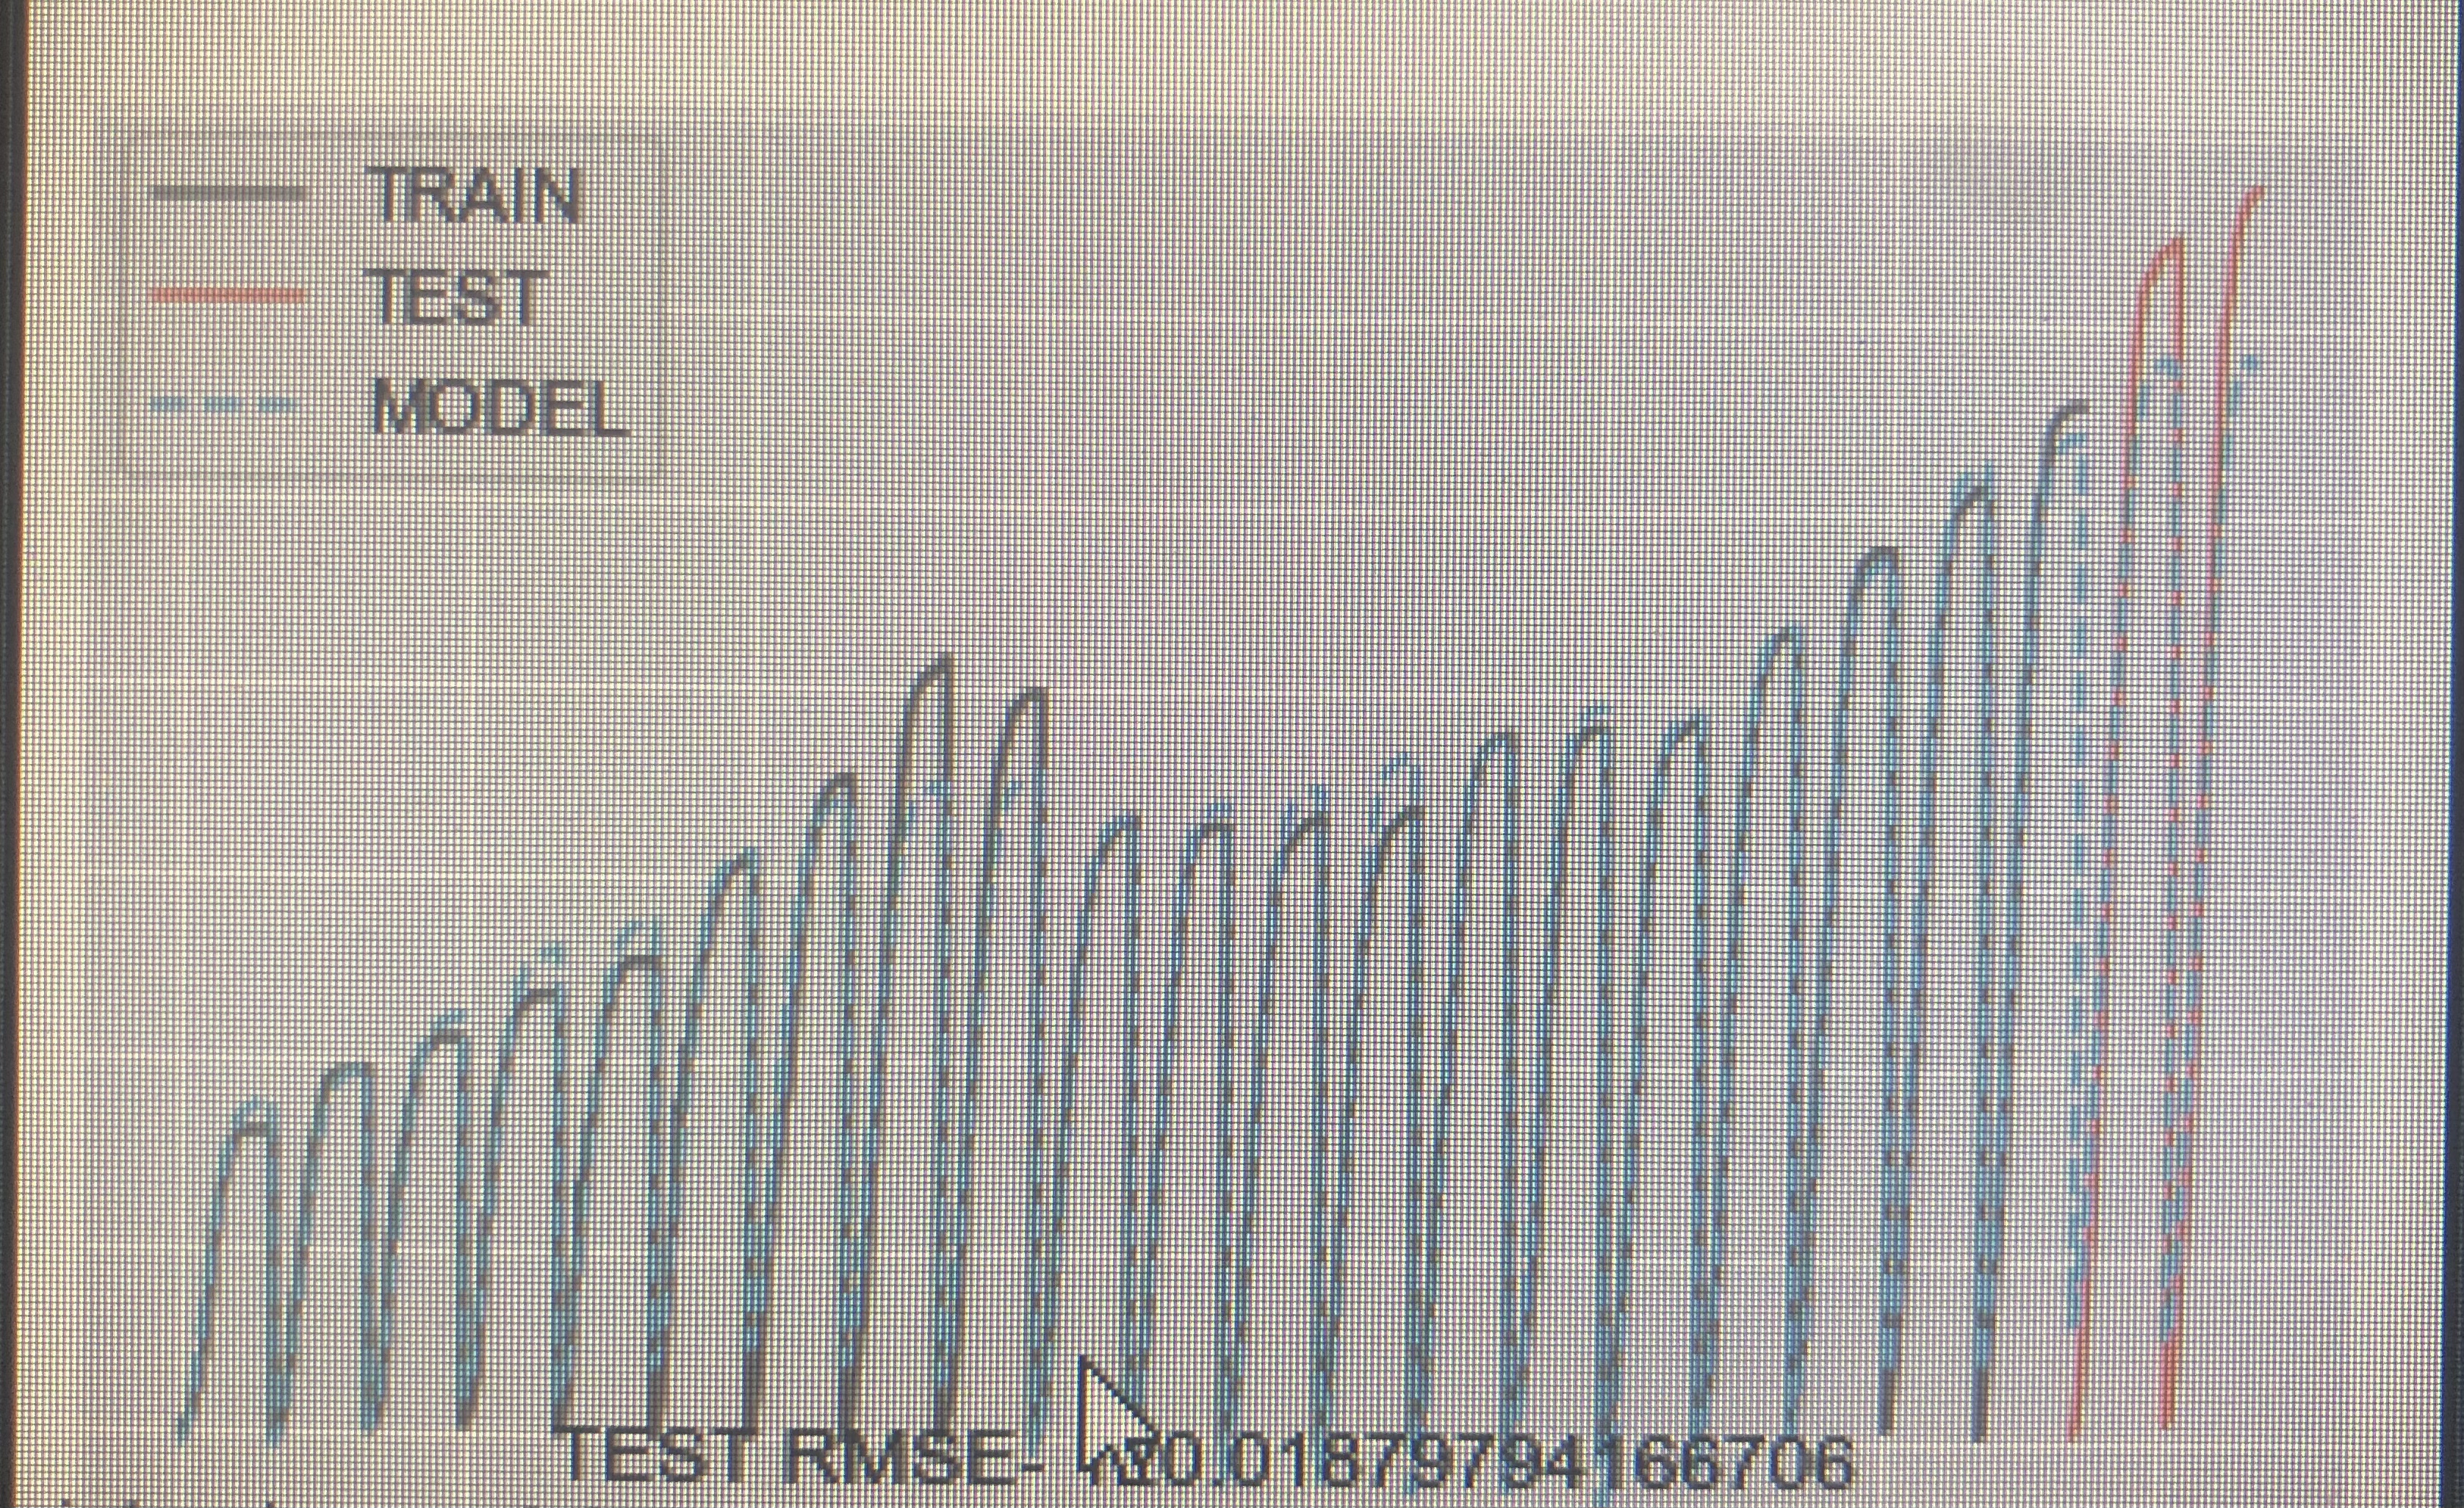
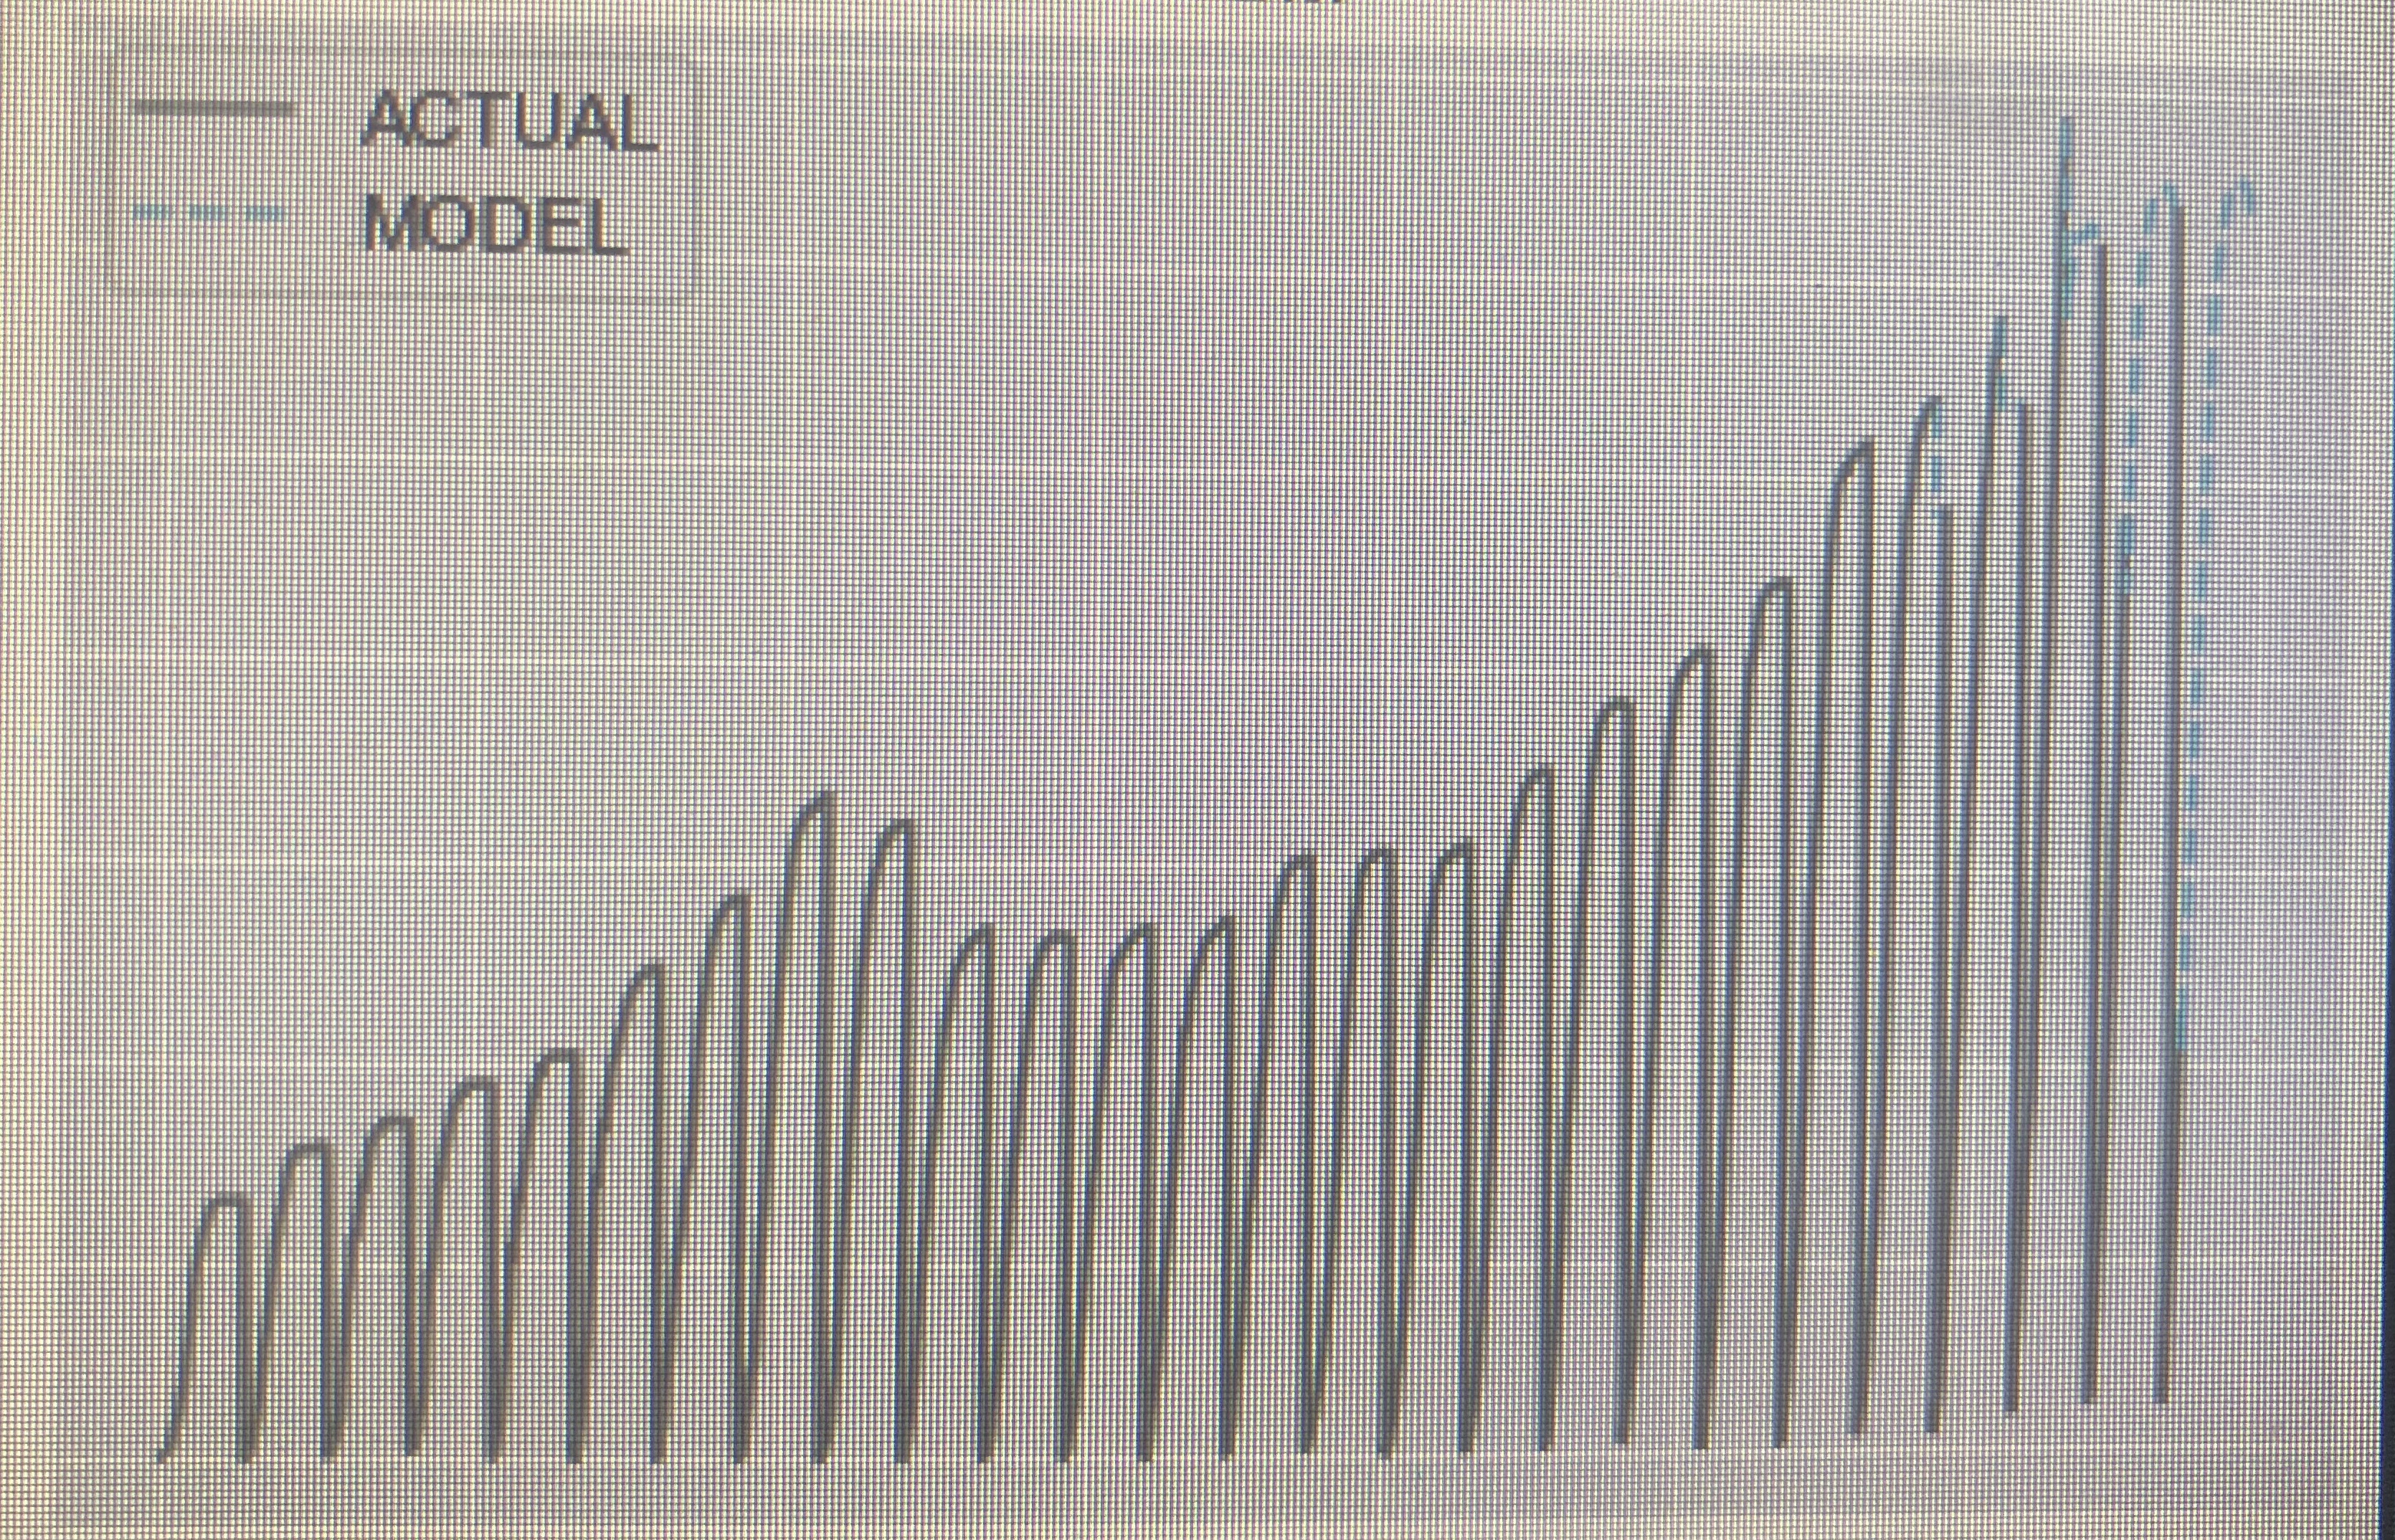
The thing is, because it’s not truly a chronological data there are gaps in the timeseries for classes that haven’t yet finished school. And so I make prediction first on the oldest class that is still missing data and then use that predicted data to fit the model again and predict the next class.
This method has worked quite well for most of the data bases I performed it on, but in some cases it doesn’t capture a sharp spike in the trend.
I am adding two images to try and visualize my problem. The first is in the stage of the model selection, you can see the actual data and the model that was selected after a grid search. The second shows the prediction method. Where the black line represents the actual data and the blue dashed line represents the prediction of each class' missing data. In the graphs you can clearly see each class as the number of dropout student grows for each data point until it peaks and a new class starts immediately after.
I am very limited with providing any code or data since it’s a private project. I hope I was able to explain my situation and if needed I can try to provide some examples of the data and the forecasting method.
Contributor guide
Assessment
This issue has not been assessed yet.