How to predict periodic discrete data?
- Dominant language
- Python
- Stars
- 20.4k
- Forks
- 4.6k
- Avg merge
- 19h 52m
- Merged PRs (30d)
- 1
Description
Here's my data
1980-01-06 16:00:00,60
1980-01-07 00:00:00,0
1980-01-07 08:00:00,60
1980-01-07 16:00:00,0
1980-01-08 00:00:00,60
1980-01-08 08:00:00,0
1980-01-08 16:00:00,60
1980-01-09 00:00:00,0
1980-01-09 08:00:00,60
1980-01-09 16:00:00,0
1980-01-10 00:00:00,60
1980-01-10 08:00:00,0
1980-01-10 16:00:00,60
1980-01-11 00:00:00,0
1980-01-11 08:00:00,60
.....
[1.csv](https://github.com/facebook/prophet/files/9080795/1.csv)
Here's my code
```
import pandas as pd
from prophet import Prophet
import matplotlib.pyplot as plt
df = pd.read_csv(r'1.csv')
m = Prophet(changepoint_prior_scale=0.9, interval_width=0.9, growth='linear', changepoint_range=1)
m.fit(df)
future = m.make_future_dataframe(periods=120, freq='H')
forecast = m.predict(future)
fig1 = m.plot(forecast)
plt.savefig("example1.png")
fig2 = m.plot_components(forecast)
plt.savefig("example2.png")
```
Here's result
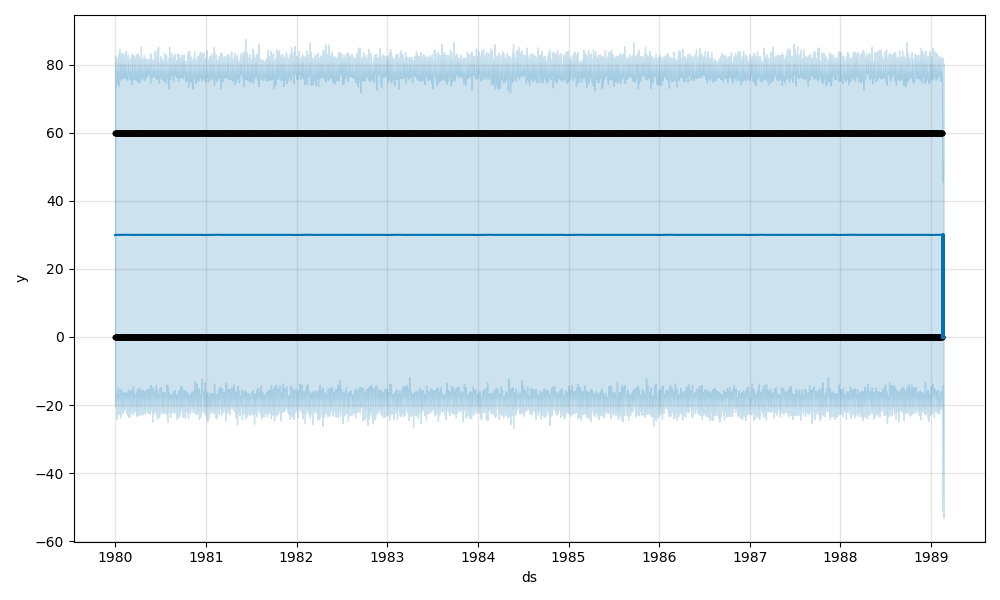
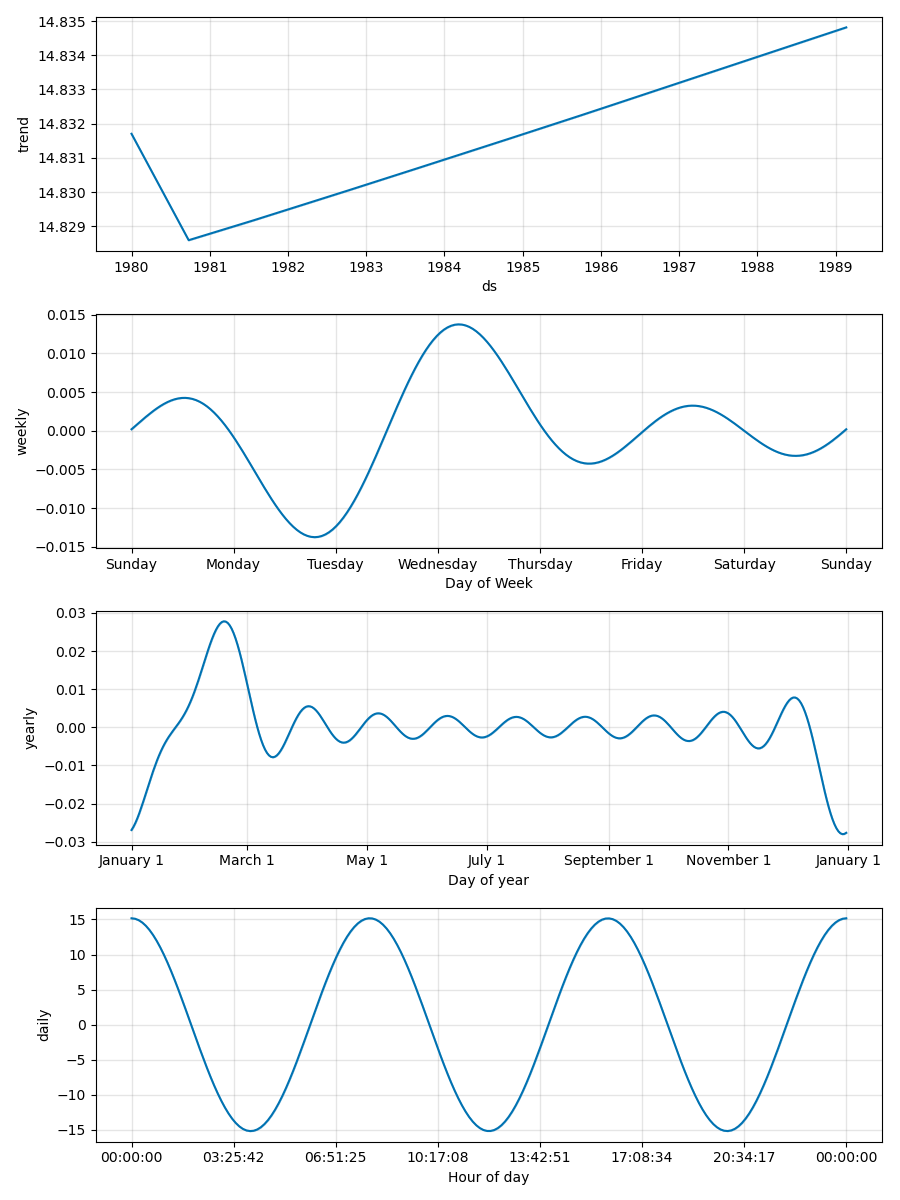
Without a good fit, how should I tune the parameters ?
Contributor guide
Assessment
This issue has not been assessed yet.