Visualize extra regressors separately
Open
question
- Dominant language
- Python
- Stars
- 20.4k
- Forks
- 4.6k
- Avg merge
- 19h 52m
- Merged PRs (30d)
- 1
Description
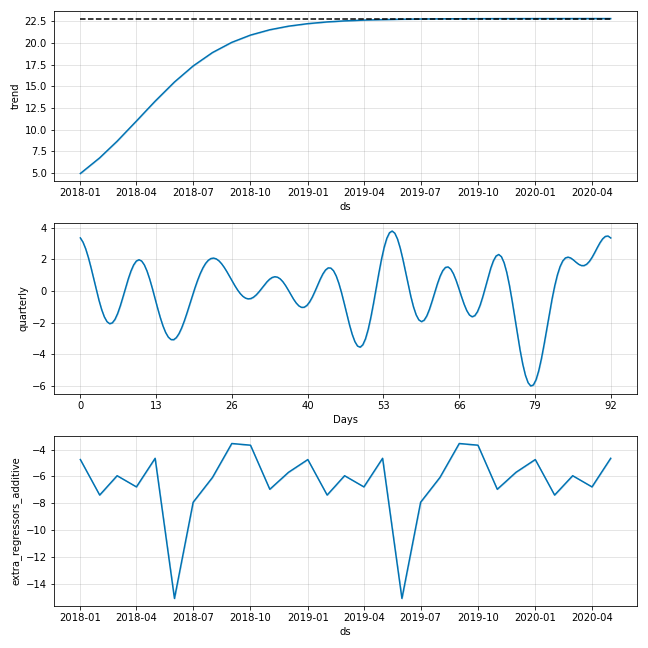
In the current plot_components plot, the added extra regressors' components are in one line plot. Is there a way to visualize the extra regressors separately? For example, I added the monthly regressors as I am fitting monthly data, and at the same time I also want to add macroeconomic data as extra regressors. If they can be visualized separately, then I will be able to interpret them separately
.
Contributor guide
Assessment
This issue has not been assessed yet.