components plots is inconsistent with df_pred on monthly seasonality
- Dominant language
- Python
- Stars
- 20.4k
- Forks
- 4.6k
- Avg merge
- 19h 52m
- Merged PRs (30d)
- 1
Description
## Background
I perform seasonal-trend decomposation on timeseries. In my scenario, I cared about 3 different components, which are trend/weekly(7 days)/monthly(30.5 days as prophet doc suggests) components.
After we decompose each component, we may want to get the volume between and within each component. For example, we may want to compare weekly and monthly seasonality to tell which one is more important. For a particular seasonality component, take weekyly seasonality as example, we may need to know the strength of each weekday.
In prophet, we can draw decomposation with `plot_components` method. I want to get the data points in each component subplot so that I can know estimated volume of each weekday/day of month.
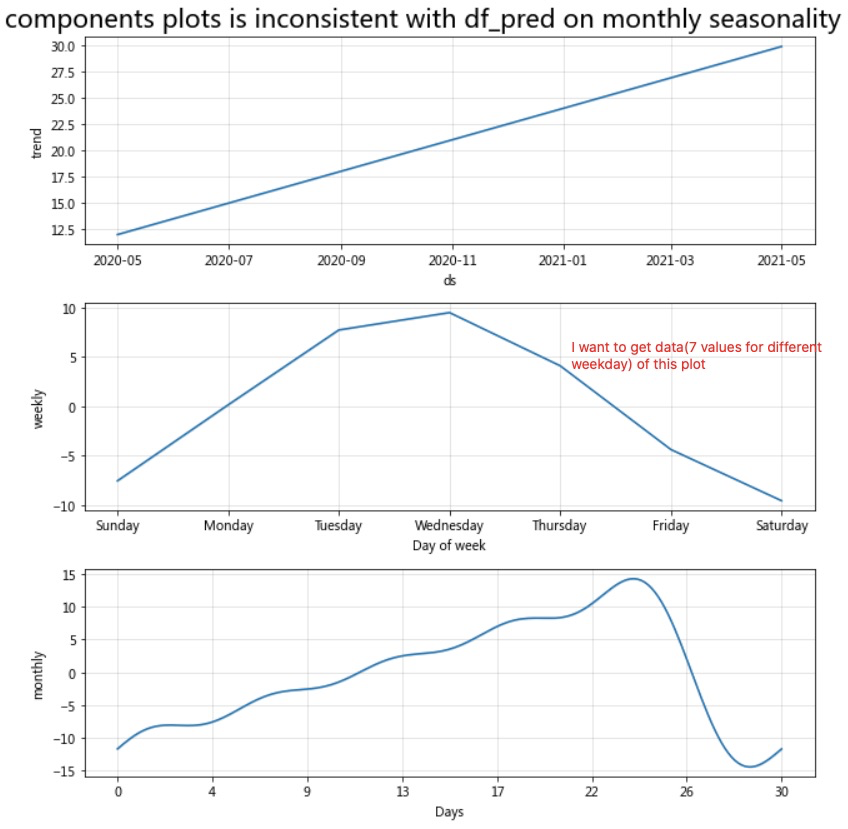
I make a synthetic dataset to reproduce my findings. The ground truth of monthly seasonality is linear, but the predicted value is confusing.
```
import pandas as pd
from prophet import Prophet
###### data genaration
ds = pd.date_range(start = '2020-05-01', end = '2021-05-01', freq = 'D')
synthetic_data = pd.DataFrame({'ds':ds})
# linear trend
synthetic_data['trend'] = synthetic_data.index*0.05 + 1
# weekly seasonality
synthetic_data['weekly'] = 10*np.sin(synthetic_data.ds.dt.weekday/7*2*np.pi)
# monthly seasonality
synthetic_data['monthly'] = 1*synthetic_data.ds.dt.day
# add noise to get additive ts
synthetic_data['y'] = synthetic_data['trend'] + synthetic_data['weekly'] + synthetic_data['monthly'] + np.random.normal(0,5)
###### model fitting and components plot
m = Prophet(seasonality_mode='additive',
# changepoint_prior_scale = 0.005,
# holidays_prior_scale= 20,
# yearly_seasonality= 1,
weekly_seasonality= 1,
daily_seasonality= 0
)
m.add_seasonality('monthly', period= 30.5,fourier_order = 5)
m.fit(synthetic_data)
future = m.make_future_dataframe(periods= 0, freq = 'd')
df_pred = m.predict(future)
fig = m.plot_components(df_pred)
plt.suptitle('components plots is inconsistent with df_pred on monthly seasonality',y= 1.02,fontsize = 20)
plt.show()
```
## My attempt
I have no idea of getting data points in each component plot, so I tried to calculate them based on `df_pred = m.predict(future)`.
### It may work fine with built-in weekly seasonality
I think I can get data points of weekly seasonality componet using this code:
```
# 6 for Sunday, 0 for Monday. This weekly predicted result is consistent with components plot.
df_pred.groupby(df_pred.ds.dt.weekday).weekly.mean()
```
> ds
0 0.150872
1 7.748597
2 9.511470
3 4.112012
4 -4.383875
5 -9.578614
6 -7.560462
Name: weekly, dtype: float64
If we compare the code output and weekly component plot, we can find they are consistent.
### Does not work with self-define monthly seasonality
Then I calculate monthly seasonality from `df_pred` too.
```
# I think 1 is for first day, 31 for lastday. This monthly predicted result is nonconsistent with components plot.
df_pred.groupby(df_pred.ds.dt.day).monthly.mean()
```
> ds
1 -3.567997
2 -10.775579
3 -13.482367
4 -12.816576
5 -10.644709
6 -8.886286
7 -8.210471
8 -7.986831
9 -7.286549
10 -5.873002
11 -4.305186
12 -3.227050
13 -2.673673
14 -2.097752
15 -1.015542
16 0.460024
17 1.766795
18 2.539023
19 3.032579
20 3.850227
21 5.250232
22 6.802167
23 7.821215
24 8.174247
25 8.571022
26 9.883497
27 12.022506
28 13.481589
29 12.635564
30 7.903723
31 1.138457
Name: monthly, dtype: float64
**However, I find inconsistent result on monthly seasonality:**
1. The monthly seasonality in synthetic data is 1*synthetic_data.ds.dt.day, which is simple linear relationship. In components plot, the monthly seasonality is not linear.
2. The monthly seasonality differs from my calculation on `df_pred.monthly`

## Summary of my question
1. Did I do something wrong during model fitting? e.g. declare a wrong monthly seasonality (`m.add_seasonality('monthly', period= 30.5,fourier_order = 5)`). So that I get a wrong monthly component plot.
2. How to get data points in component plot? Did I do right on weekly component and what's wrong with self-define monthly component? From source code, I know `m.plot_components` treat built-in weekly seasonality and self-define monthly seasonality differently.
Contributor guide
Assessment
This issue has not been assessed yet.