euroargodev / euroargodev/BlueCloud
Temporal representation of classes
- Dominant language
- Jupyter Notebook
- Stars
- 0
- Forks
- 1
- PR merge metrics
- No merged PRs in 30d
Description
I added some new graphical representations to show a seasional distribution of classes.
I used as exemple the mediterranean argo dataset from 2012 to 2013. Here is the spatial distribution of classes, posteriors and profiles:
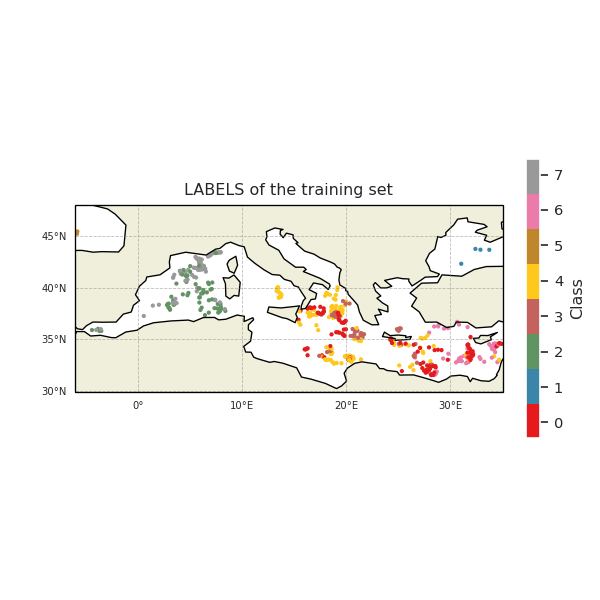
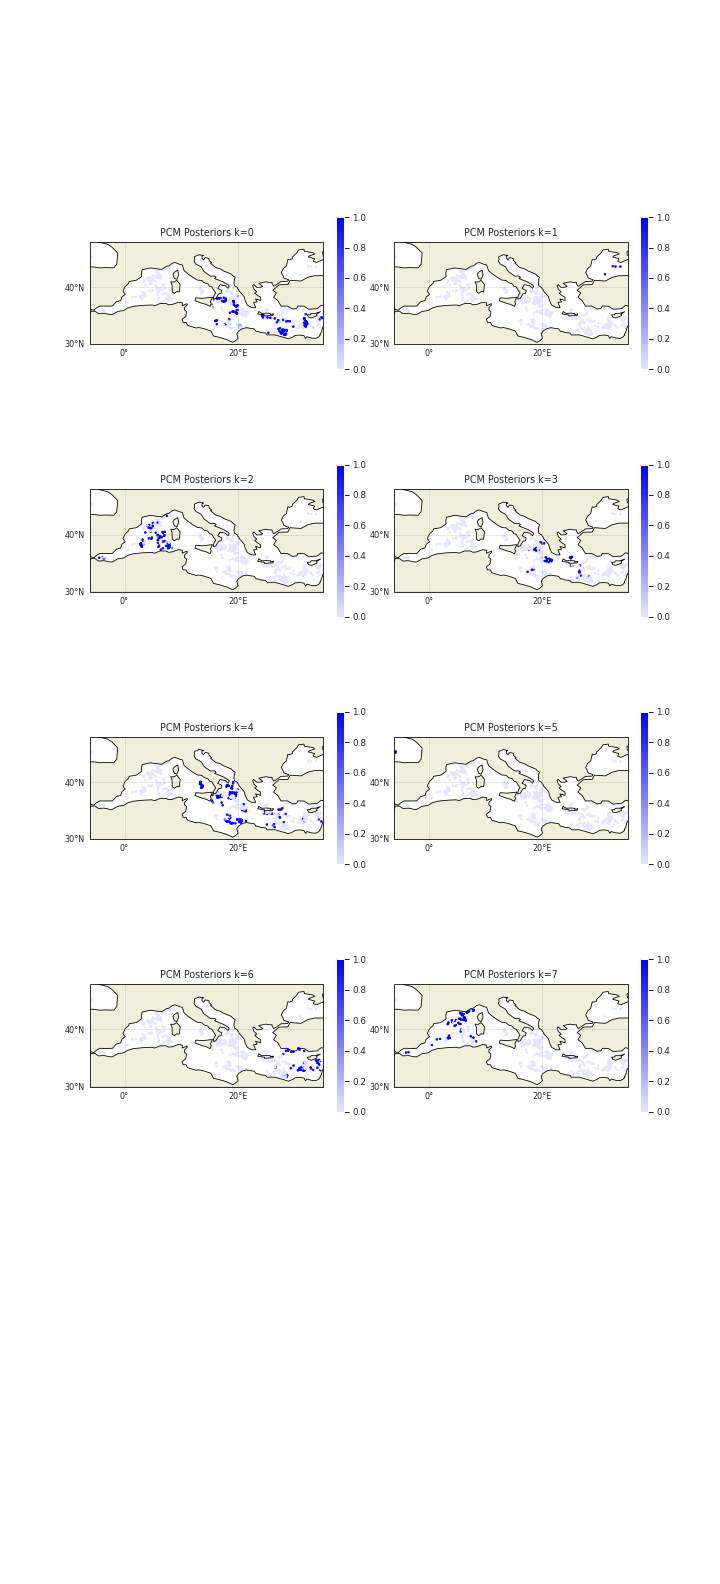
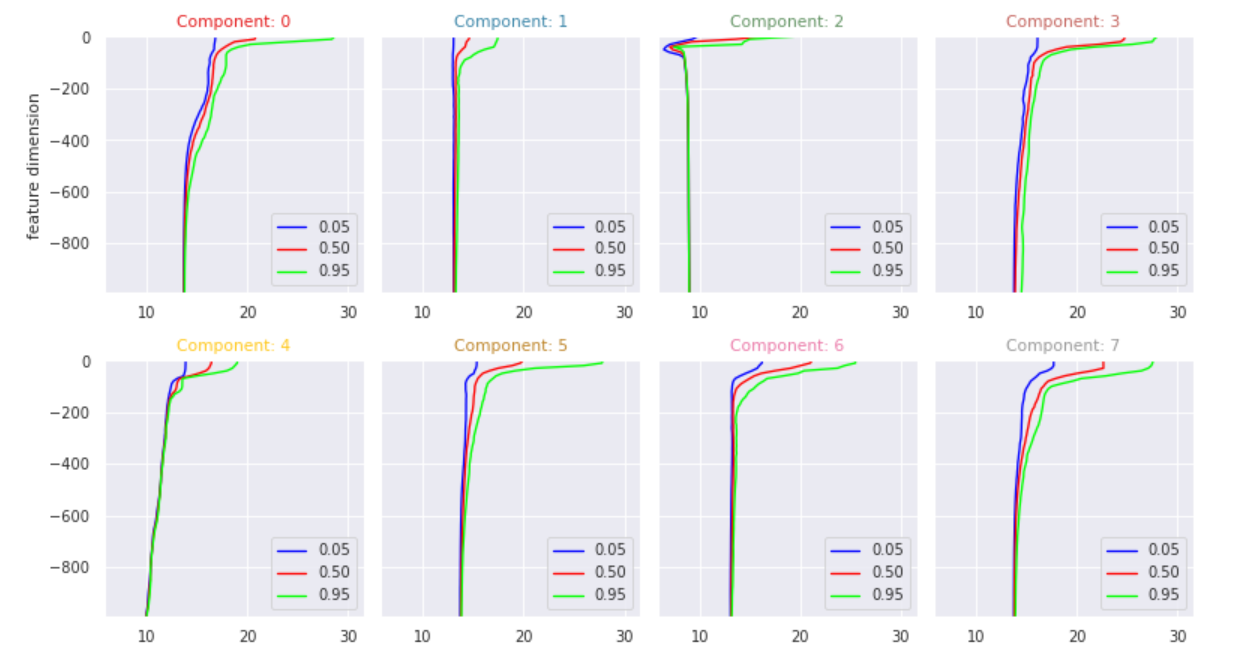
Classes k=5 and k=1 correspond to Atlantic and Black see so they are not taken in to account. We find 2 classes in the western basin (k =2 and k=7) , one class in the central basin (k = 3) and one class in the eastern basin (k = 6). Classes k = 4 and k =0 are both in central and eastern basins.
Bar plots showing number of profiles per class grouped by month and by season are:
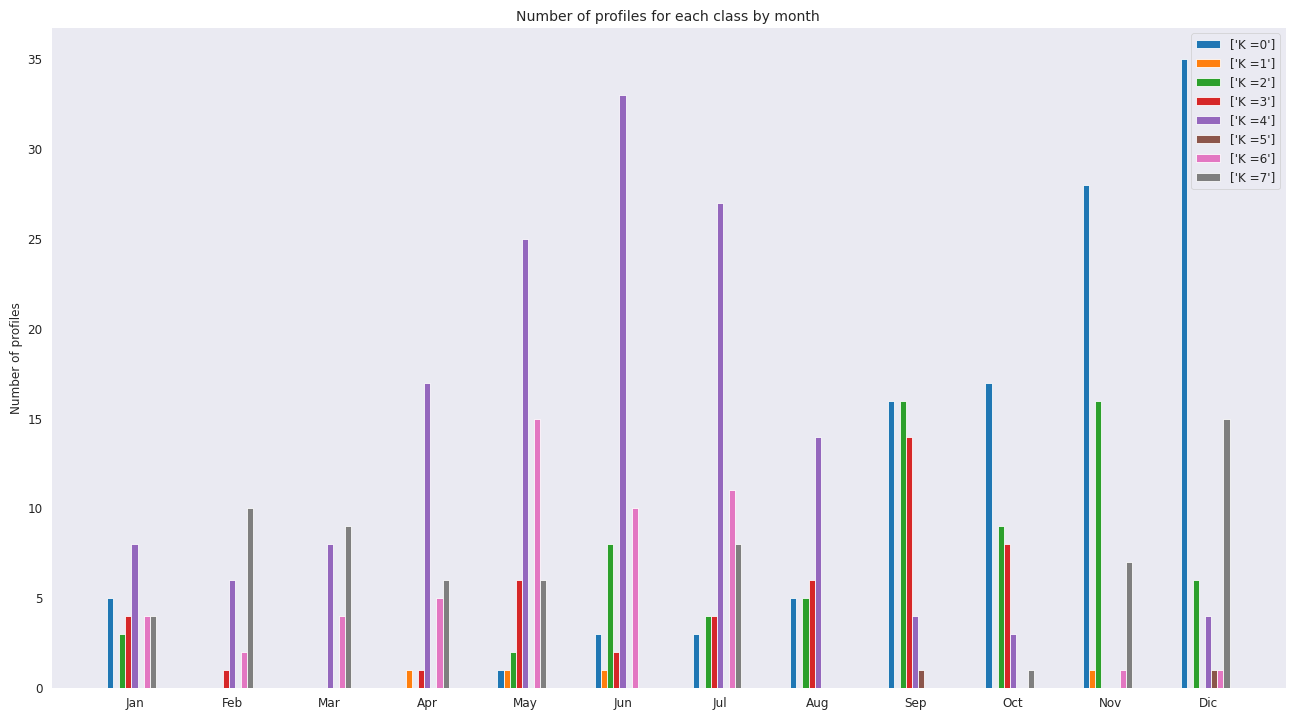
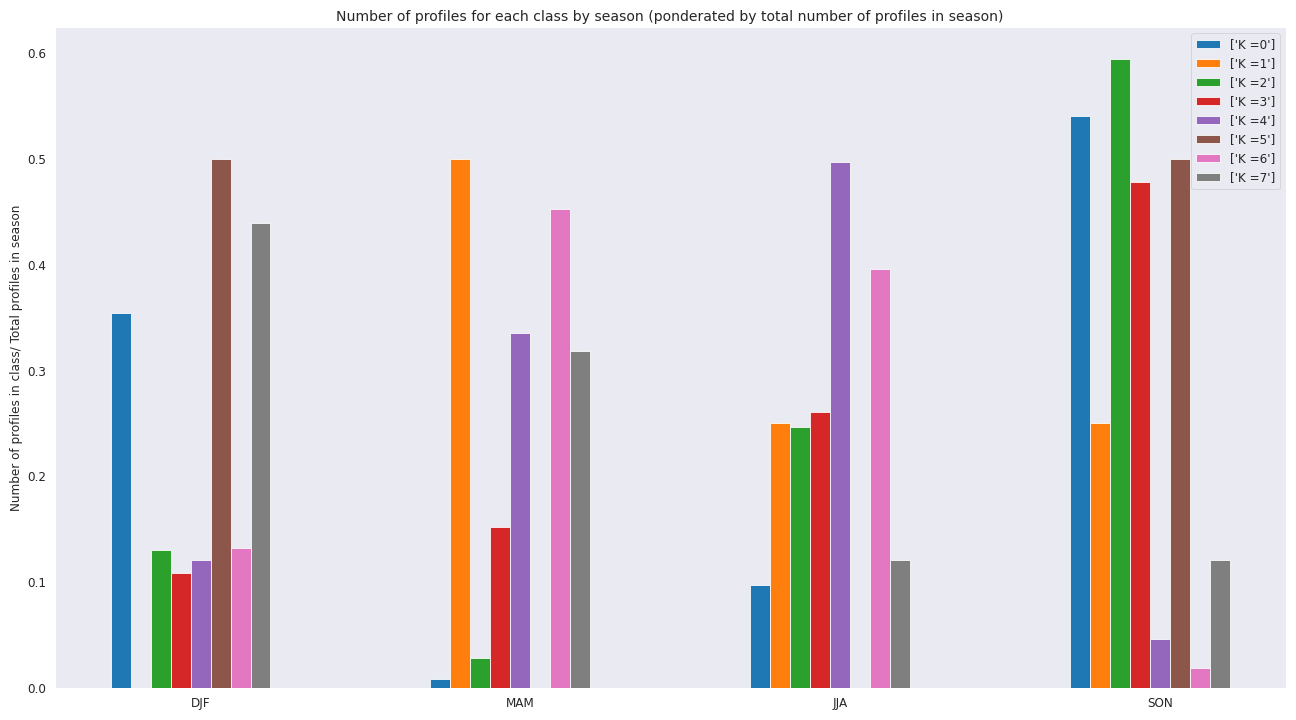
We can distinguish a seasonal behavior. For exemple: k = 0 shows a maximun in december and k= 4 shows a maximun in June. But regarding the profiles of these 2 classes I am not sure that they correspond to winter (k=0) and summer (k=4) profiles. What do you thing about it?
Contributor guide
No contributing guide indexed for this repository
Assessment
This issue has not been assessed yet.