esphome / esphome/feature-requests
Add support for "filled" graphs in the graph component
- Dominant language
- No language data
- Stars
- 450
- Forks
- 29
- PR merge metrics
- No merged PRs in 30d
Description
**Describe the problem you have/What new integration you would like**
Add an option to the [graph component](https://esphome.io/components/display/index.html#graph-component) to allow drawing a "filled" graph i.e. where the whole graph area is filled with a colour, rather than drawing just a line.
**Please describe your use case for this integration and alternatives you've tried:**
For some kind of displays/visualisations it's much more impactful/readable from a distance to show a filled chart. See example below of something I've implemented manually to draw on an epaper display.
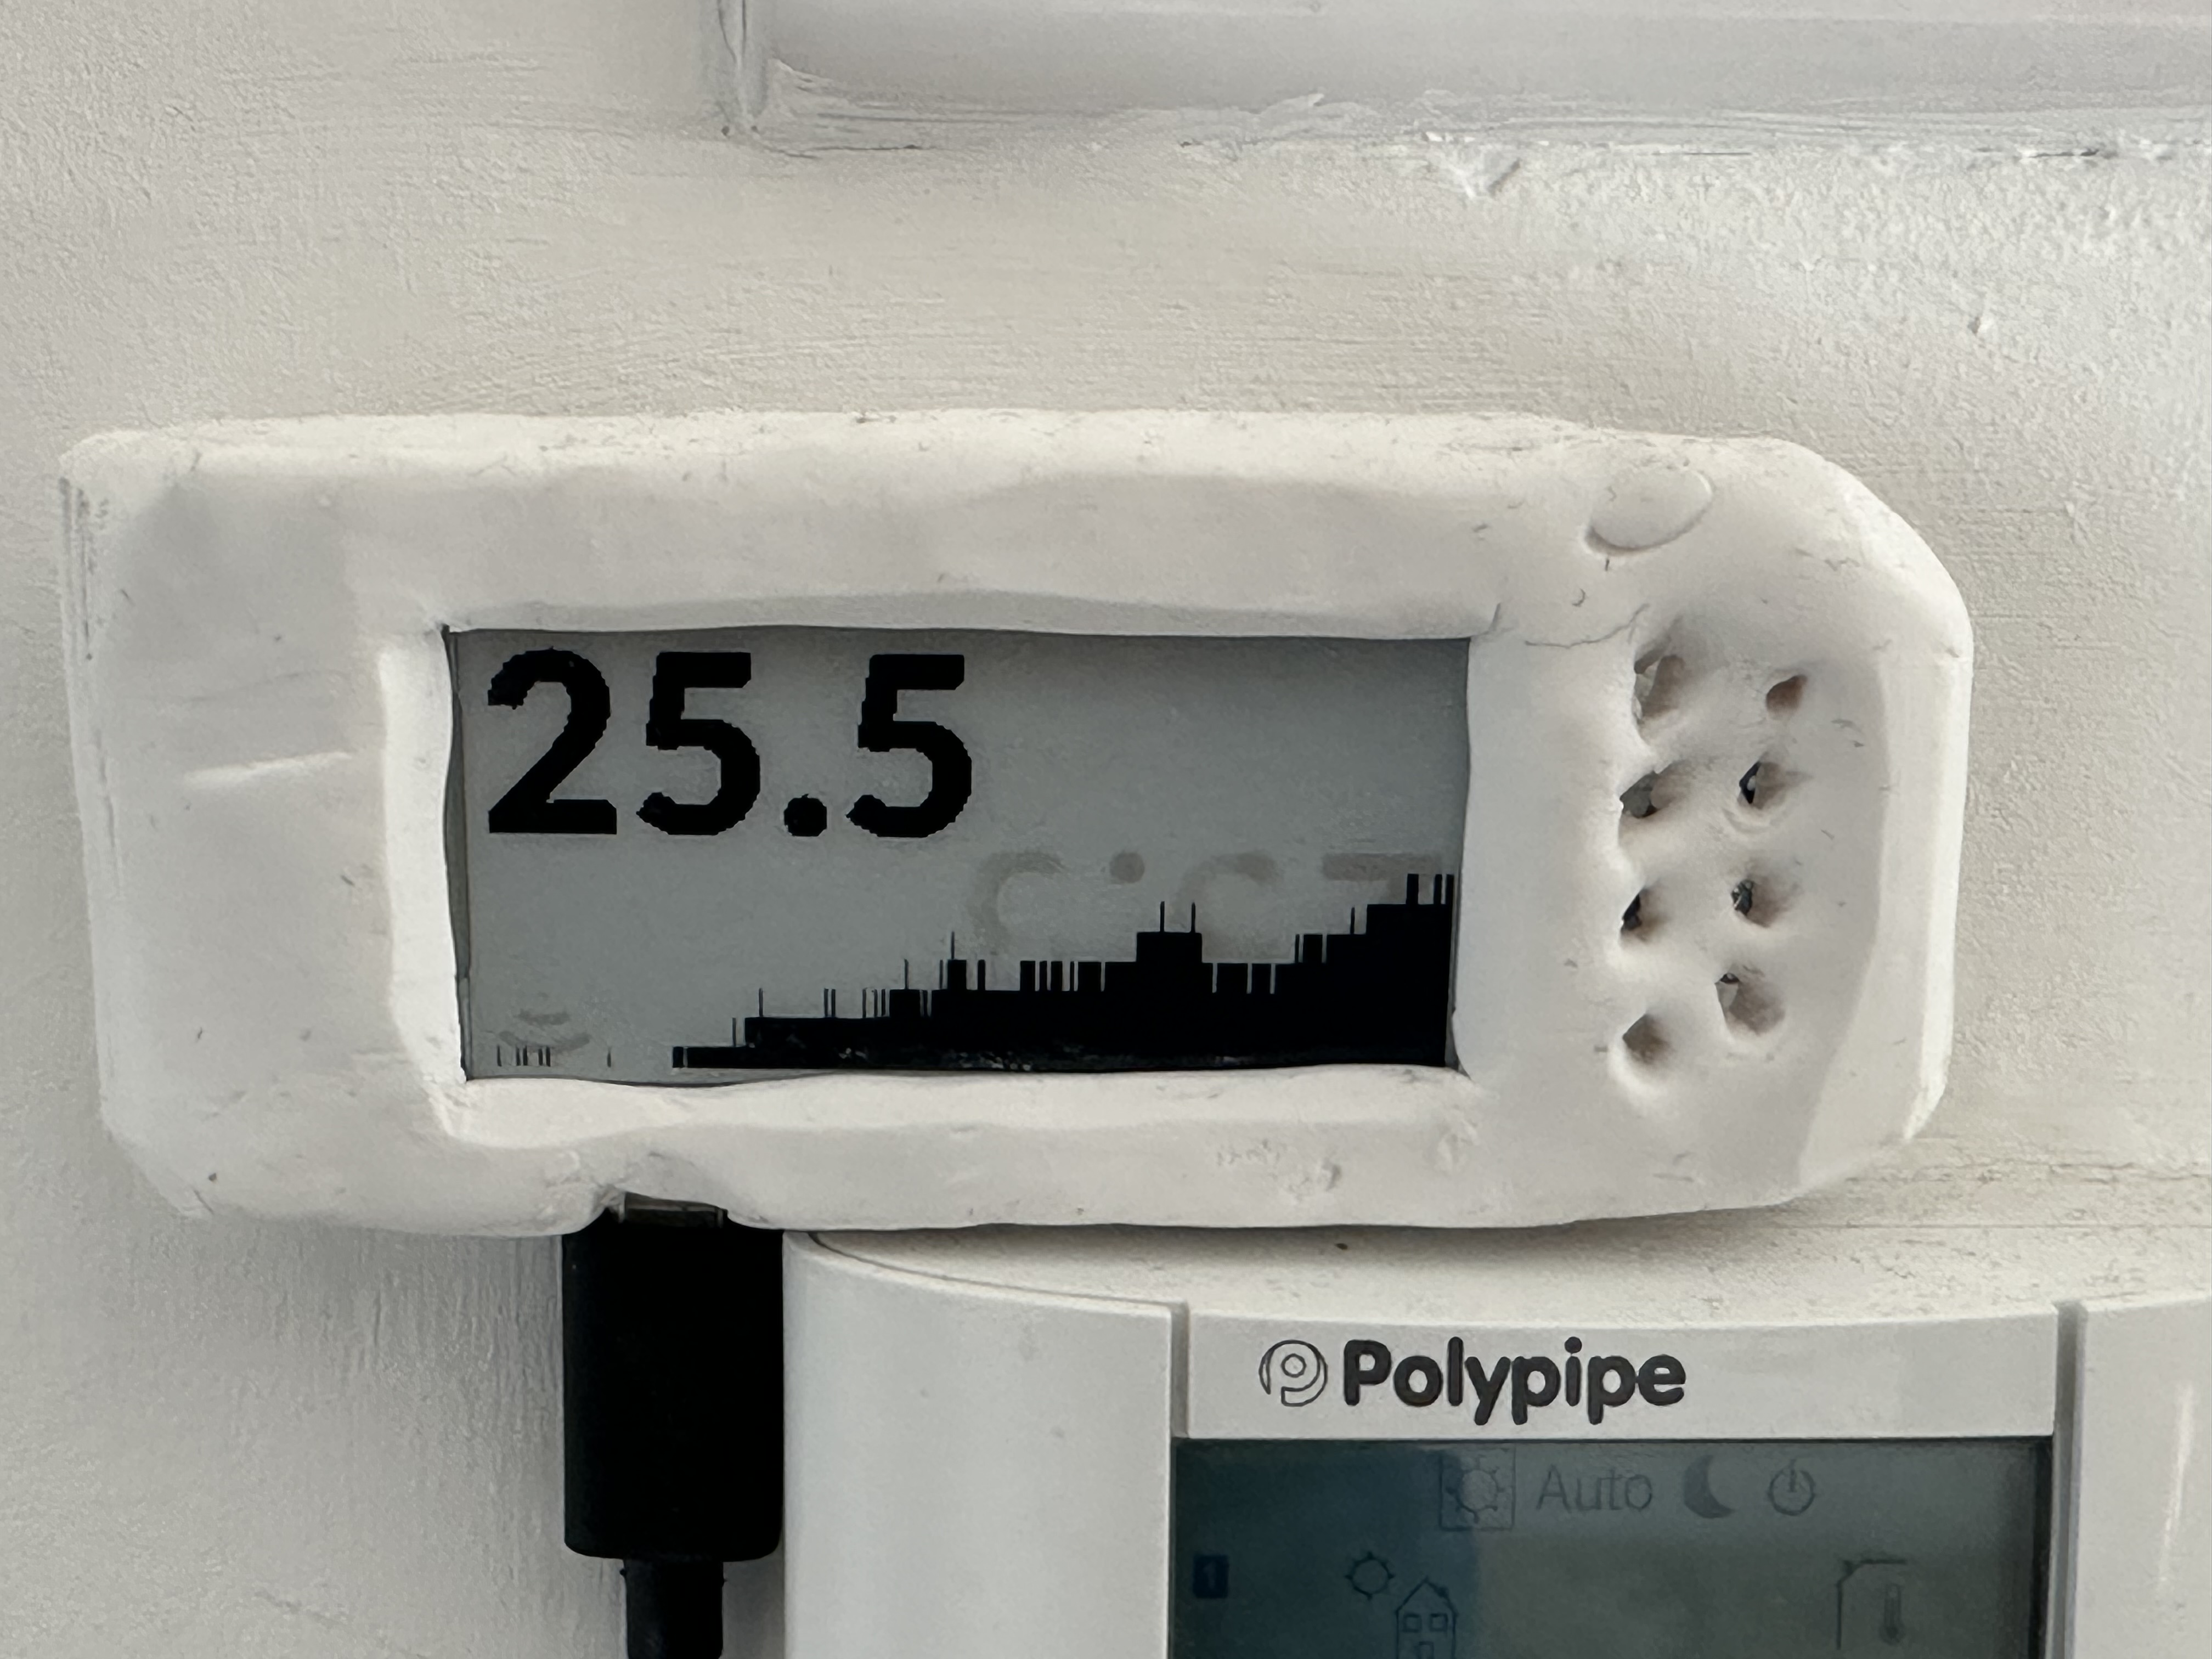
**Additional context**
Obviously this is only easy to implement when showing a single trace. With multiple traces the layering might be hard to figure out. But I guess in an initial version this option can be restricted to graphs containing only one trace, by validating the YAML input?
Contributor guide
No contributing guide indexed for this repository
Assessment
This issue has not been assessed yet.