Is it possible to draw a graph consisting of tables (or letters)
- Dominant language
- C++
- Stars
- 6.2k
- Forks
- 693
- PR merge metrics
- No merged PRs in 30d
Description
Hi all! I wanted to use this cool library for my purposes.
I want to use it to draw a graph like this:
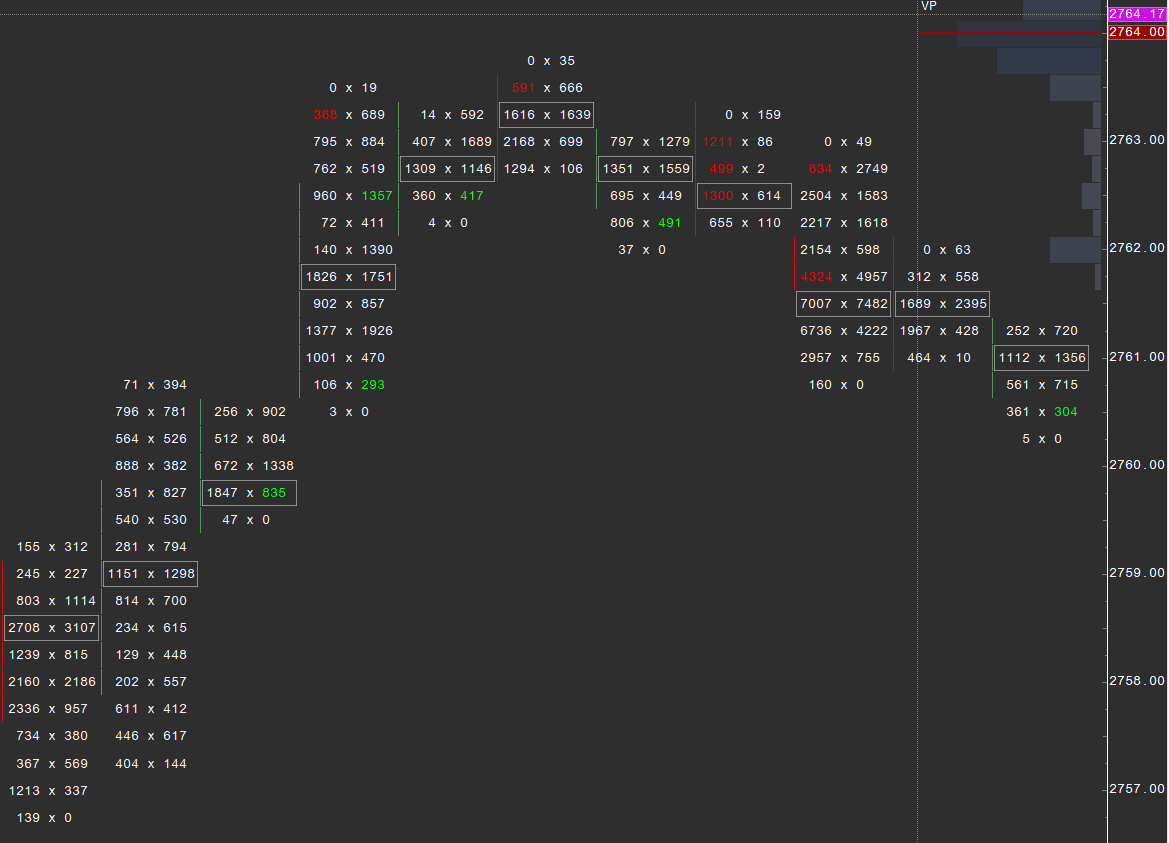
Note that we are referring to the table of numbers (consisting of two rows) as well as the small graphical bars (green or red next to the tables)
Perhaps some of you have drawn something similar and have examples.
The second type of chart I would like to have is this:
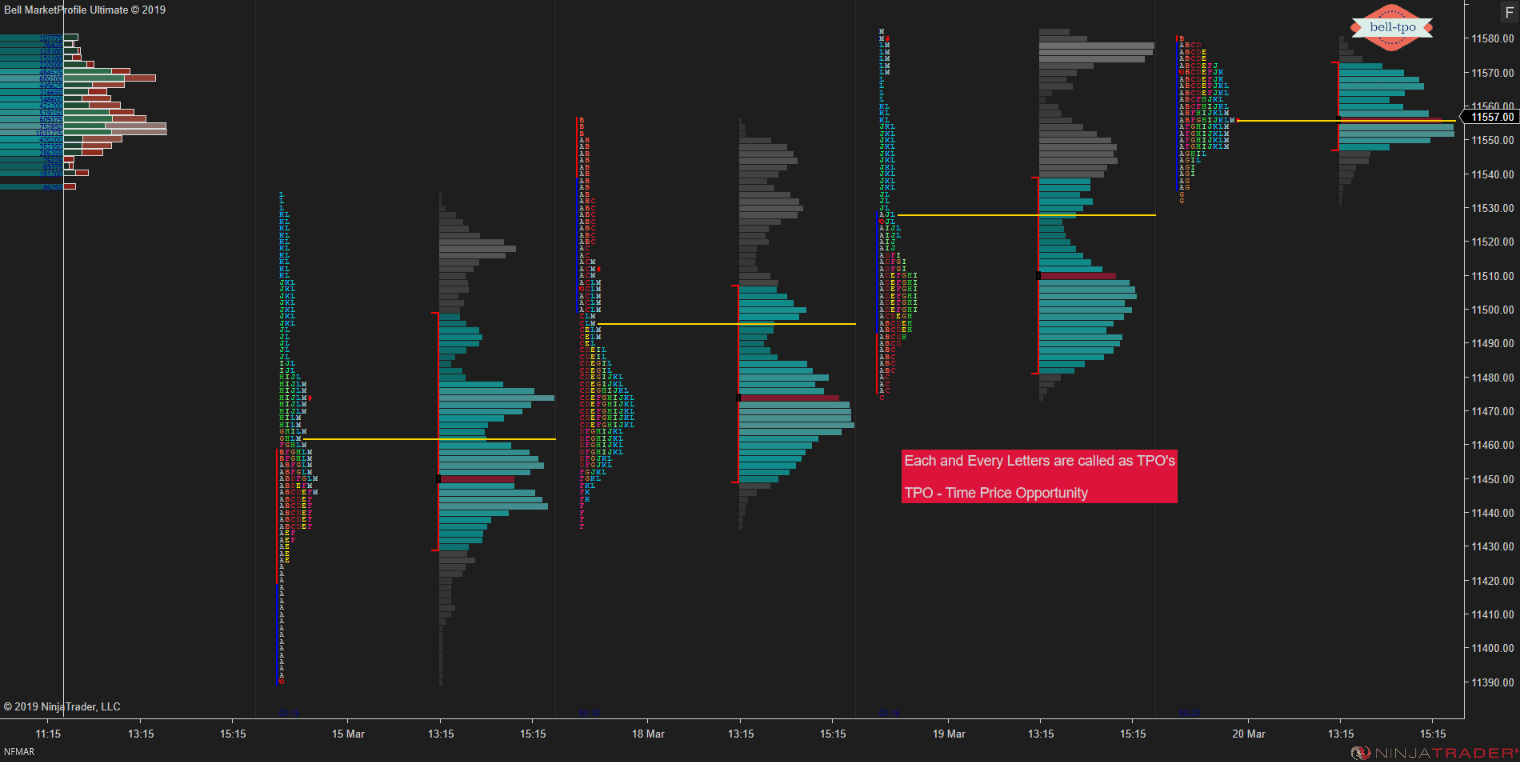
It's more like a " chart in a chart"
Note that the bars can be multi-colored, and consist of letters near them we also see a lot of bars (as far as I understood it can be done by annotations)
Contributor guide
No contributing guide indexed for this repository
Assessment
This issue has not been assessed yet.