Some error messages are not being shown
- Dominant language
- Java
- Stars
- 8
- Forks
- 3
- PR merge metrics
- No merged PRs in 30d
Description
Hello! I'm running Timebase Administrator v.1.0.4 using Docker image _epam/timebase-ws-server:1.0.4_ and Timebase server from the image _finos/timebase-ce-server:6.1_. I've initialized the server with some test data, as it described [here](https://kb.timebase.info/community/overview/quick-start).
I've noticed that in some cases, when I'm making a mistake in my queries, I'm not getting any error messages in web UI. For example, in a case of the following request:
`SELECT * FROM "bars" WHERE symbol = 'IBM' and volume > 20000`
I'm getting an error message "1.35..36: 1.35..36: Syntax error"
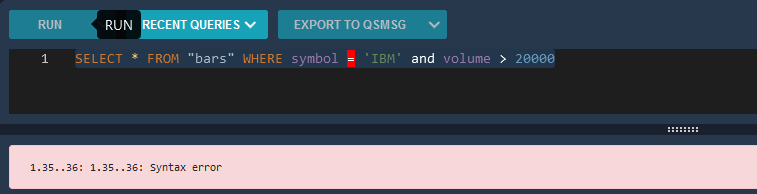
At the same time, I'm not getting anything for the next request:
`SELECT count(*) FROM "bars" WHERE symbol == 'IBM' and volume > 20000`
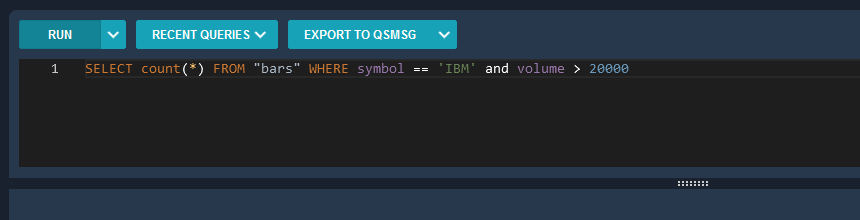
Meanwhile, there is a couple of 500 errors in browser's web console, but UI doesn't produce any error messages for them.
Please, check HAR file [attached](https://github.com/epam/TimebaseWS/files/9054722/tb_web_wrong_requests.zip).
Contributor guide
No contributing guide indexed for this repository
Assessment
This issue has not been assessed yet.