Masking a surface plot
- Dominant language
- Python
- Stars
- 1.4k
- Forks
- 316
- Avg merge
- 7h 44m
- Merged PRs (30d)
- 5
Description
Hi All:
I just switched to Python3 and I noticed a behavioral change in mayavi plotting. For reference I'm using a macOS 10.15.6 Catalina. I'm using Python3.8.5 installed through pyenv. My mayavi is installed through pip.
My goal is to mask certain regions of a surface plot when using the mlab.mesh function. Here's an example with a gaussian surface.
```python
import numpy as np
from mayavi import mlab
x,y = np.linspace(-0.5,0.5,100),\
np.linspace(-0.5,0.5,100)
xx,yy = np.meshgrid(x,y,indexing='ij')
rr = np.sqrt(xx**2+yy**2)
zz = np.exp(-rr**2/(2*0.2**2))
```
when plotting, if I mask the inner area `rr<0.25` it works fine
```python
mask = rr<0.25
mlab.mesh(xx,yy,zz,mask=mask)
mlab.show()
```
which gives me
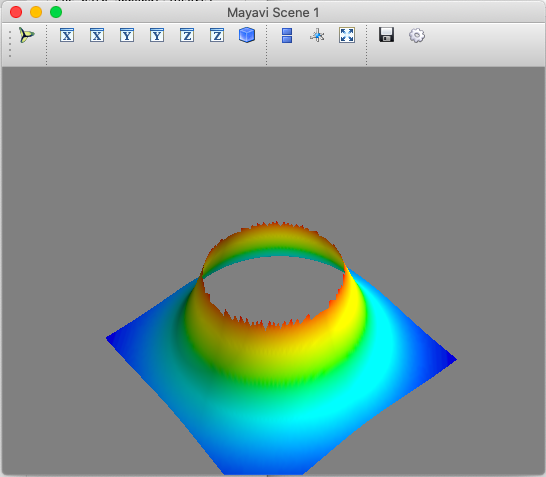
however, if I choose to mask the outer area `rr>0.25`, the whole thing disappears
```python
mask = rr>0.25
mlab.mesh(xx,yy,zz,mask=mask)
mlab.show()
```
which gives me
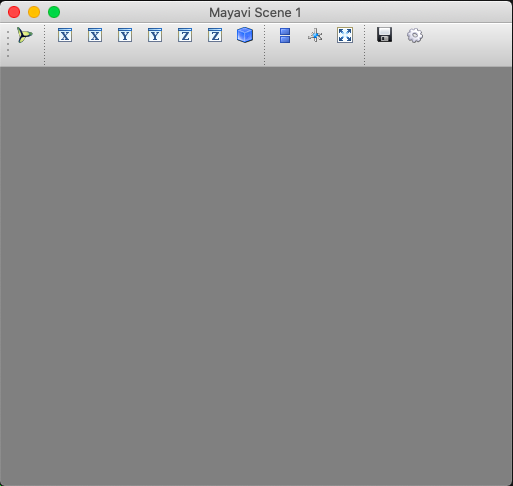
apart from using the `mask` argument, I have also tried manually setting the intended regions in the `zz` field to `np.NaN`, but with identical results.
Has anybody encountered this before? How can I resolve it? Thank you.
Contributor guide
No contributing guide indexed for this repository
Assessment
This issue has not been assessed yet.