Wrong visualizations with python3 version 3.8.2, mayavi2 version 4.7.1, python3-pyqt5 version 5.15.1 and wxpython-tools version 4.0.7
- Dominant language
- Python
- Stars
- 1.4k
- Forks
- 316
- Avg merge
- 7h 44m
- Merged PRs (30d)
- 5
Description
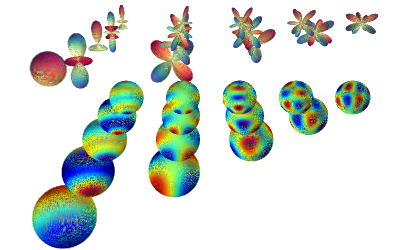
The example is the Spherical Harmonics one but it fails also with other examples. The program runs with the visualization is incorrect as in the pictures.
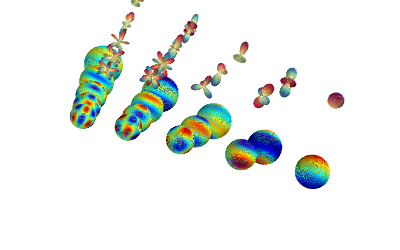
The problems I have are about rendering, sizes changing with the perspective incorrectly and wrong order changing perspective.
Author: Gael Varoquaux
Copyright (c) 2008, Enthought, Inc.
License: BSD Style.
`from mayavi import mlab
import numpy as np
from scipy.special import sph_harm
r = 0.3
pi = np.pi
cos = np.cos
sin = np.sin
phi, theta = np.mgrid[0:pi:101j, 0:2 * pi:101j]
x = r * sin(phi) * cos(theta)
y = r * sin(phi) * sin(theta)
z = r * cos(phi)
mlab.figure(1, bgcolor=(1, 1, 1), fgcolor=(0, 0, 0), size=(400, 300))
mlab.clf()
for n in range(1, 6):
for m in range(n):
s = sph_harm(m, n, theta, phi).real
mlab.mesh(x - m, y - n, z, scalars=s, colormap='jet')
s[s < 0] *= 0.97
s /= s.max()
mlab.mesh(s * x - m, s * y - n, s * z + 1.3,
scalars=s, colormap='Spectral')
mlab.view(90, 70, 6.2, (-1.3, -2.9, 0.25))
mlab.show()`
And if I rotate manually like for example here, the sizes are wrong (the farthest ones look bigger)
Contributor guide
No contributing guide indexed for this repository
Assessment
This issue has not been assessed yet.