Mayavi Contour Grid Plane Glitch
- Dominant language
- Python
- Stars
- 1.4k
- Forks
- 316
- Avg merge
- 7h 44m
- Merged PRs (30d)
- 5
Description
Hello, I'm not sure if this is the right place to get support for problems running Mayavi. If there is somewhere better, please point me there.
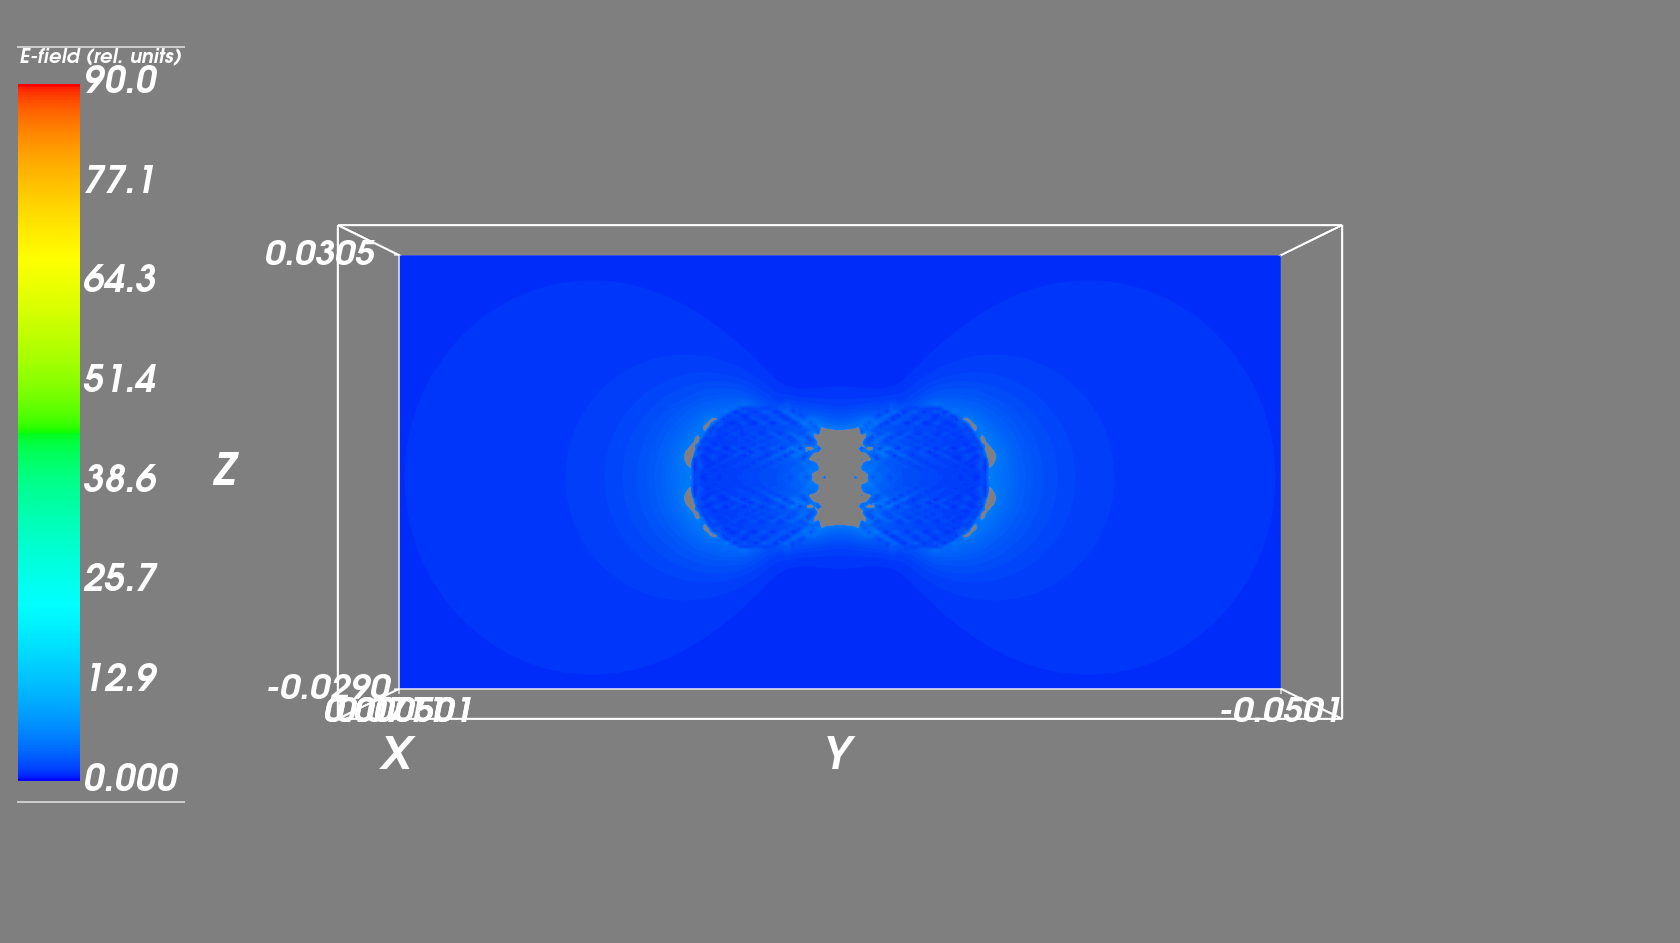
I am trying to visualize a 3d scalar field using a contour grid plane, but there is some artefacting and defects. Attaching image.
As you can see the center region is uncolored by any gradient and it is the same dull grey of the background. At first I thought the range is off, but this doesn't appear to be the issue. The data range is well within the 0-90 range.
Any insight into this?
Contributor guide
No contributing guide indexed for this repository
Research direction
Start by reproducing the reported 3D scalar-field visualization with Mayavi's contour grid plane and compare it with the attached image. The issue does not name a file, test, dataset, or minimal example, so first identify the relevant contour grid plane entry point and isolate whether the grey center is caused by the data, range, or rendering. Done means the artifact is explained and corrected, with the result verified on a focused reproduction.
Written by the indexing model from the issue text.
Assessment
- Tech stack
- python
- Domain
- computer-graphics, data-visualization
- Issue type
- Bug
- Difficulty
- 4/5
- Estimated time
- 3-5 days
- Activity status
- Stale
- Clarity
- Needs clarification
- Newbie friendliness
- 25/100