BUG: Importing axes3d from mpl:toolkits.mplot3d hinders animating with mlab
- Dominant language
- Python
- Stars
- 1.4k
- Forks
- 316
- Avg merge
- 7h 44m
- Merged PRs (30d)
- 5
Description
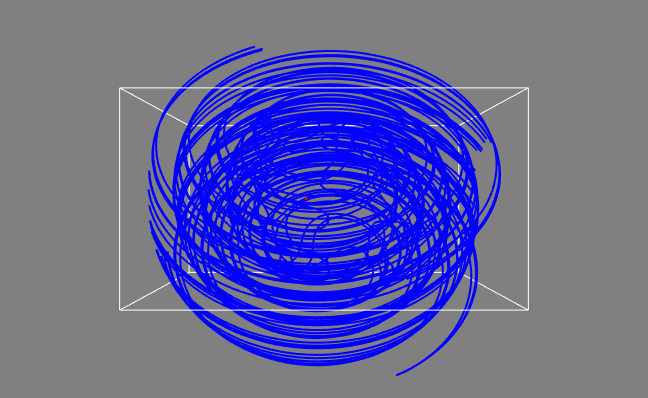
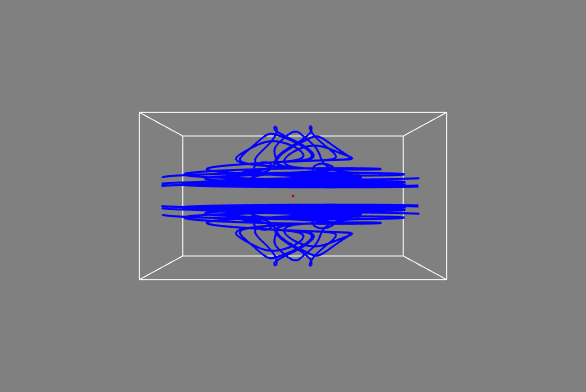
If I import axes3d from mpl_toolkits.mplot3d, even without calling for it in the code, changes the outcome of my streamline plots. It also hinders animating with mlab. Also, for some reason, the result when importing axes3d looks more correct than without.
EDIT: The change in appearance is ofc because of an error I made in the loop (w = Bx). Nevertheless, mlab won't run the animation loop with the import.
Without import, looking along the x-axis:
With import, looking along the x-axis:
```python
from mayavi import mlab
import numpy as np
from mpl_toolkits.mplot3d import axes3d
def B(x, y, z, omega, t, l, q):
r = np.sqrt(x**2 + y**2 + z**2)
r[np.where(r == 0)] = 1e-10
theta = np.arctan2(z, r)
phi = np.arctan2(y, x)
mu = 1#1.26 * 10**(-6)
c = 1#299792458
mag = -mu*q*l*omega**2/(4*np.pi*c*r)
bx = mag*np.cos(theta)*np.sin(omega*(t - r/c))
by = -mag*np.cos(theta)*np.cos(omega*(t - r/c))
bz = -mag*np.sin(theta)*np.sin(omega*(t - r/c) - phi)
return bx, by, bz
d = 4
w = 35j
x, y, z = np.mgrid[-d:d:w,-d:d:w,-d:d:w]
omega = 5
l = 1
q = 1
t = 0
Bx, By, Bz = B(x, y, z, omega, t, l, q)
field = mlab.pipeline.vector_field(x, y, z, Bx, By, Bz)
magnitude = mlab.pipeline.extract_vector_norm(field)
points = mlab.points3d([l/2*np.cos(omega*t), l/2*np.cos(omega*t + np.pi)], \
[l/2*np.sin(omega*t), l/2*np.sin(omega*t + np.pi)],
[0,0] , scale_factor = 0.08, color=(1,0,0))
#rod = mlab.plot3d([l/2*np.cos(omega*t), l/2*np.cos(omega*t + np.pi)], [l/2*np.sin(omega*t), l/2*np.sin(omega*t + np.pi)], [0,0], color=(1,0,0), line_width = 0.005)
field_lines = mlab.pipeline.streamline(magnitude, seedtype='sphere', integration_direction='both')
@mlab.animate(delay=50)
def anim():
t = 0
f = mlab.figure(1, size=(800, 400), bgcolor=(1, 1, 1), fgcolor=(0, 0, 0))
while True:
Bx, By, Bz = B(x, y, z, omega, t, l, q)
field_lines.mlab_source.set(u = Bx, v = By, w = Bx)
points.mlab_source.set(x = [l/2*np.cos(omega*t), l/2*np.cos(omega*t + np.pi)], y = [l/2*np.sin(omega*t), l/2*np.sin(omega*t + np.pi)])
#rod.mlab_source.trait_set(x = [l/2*np.cos(omega*t), l/2*np.cos(omega*t + np.pi)], y = [l/2*np.sin(omega*t), l/2*np.sin(omega*t + np.pi)])
t += .01
yield
field_lines.seed.widget.enabled = False
anim()
mlab.outline()
mlab.show()
```
Contributor guide
No contributing guide indexed for this repository
Assessment
This issue has not been assessed yet.