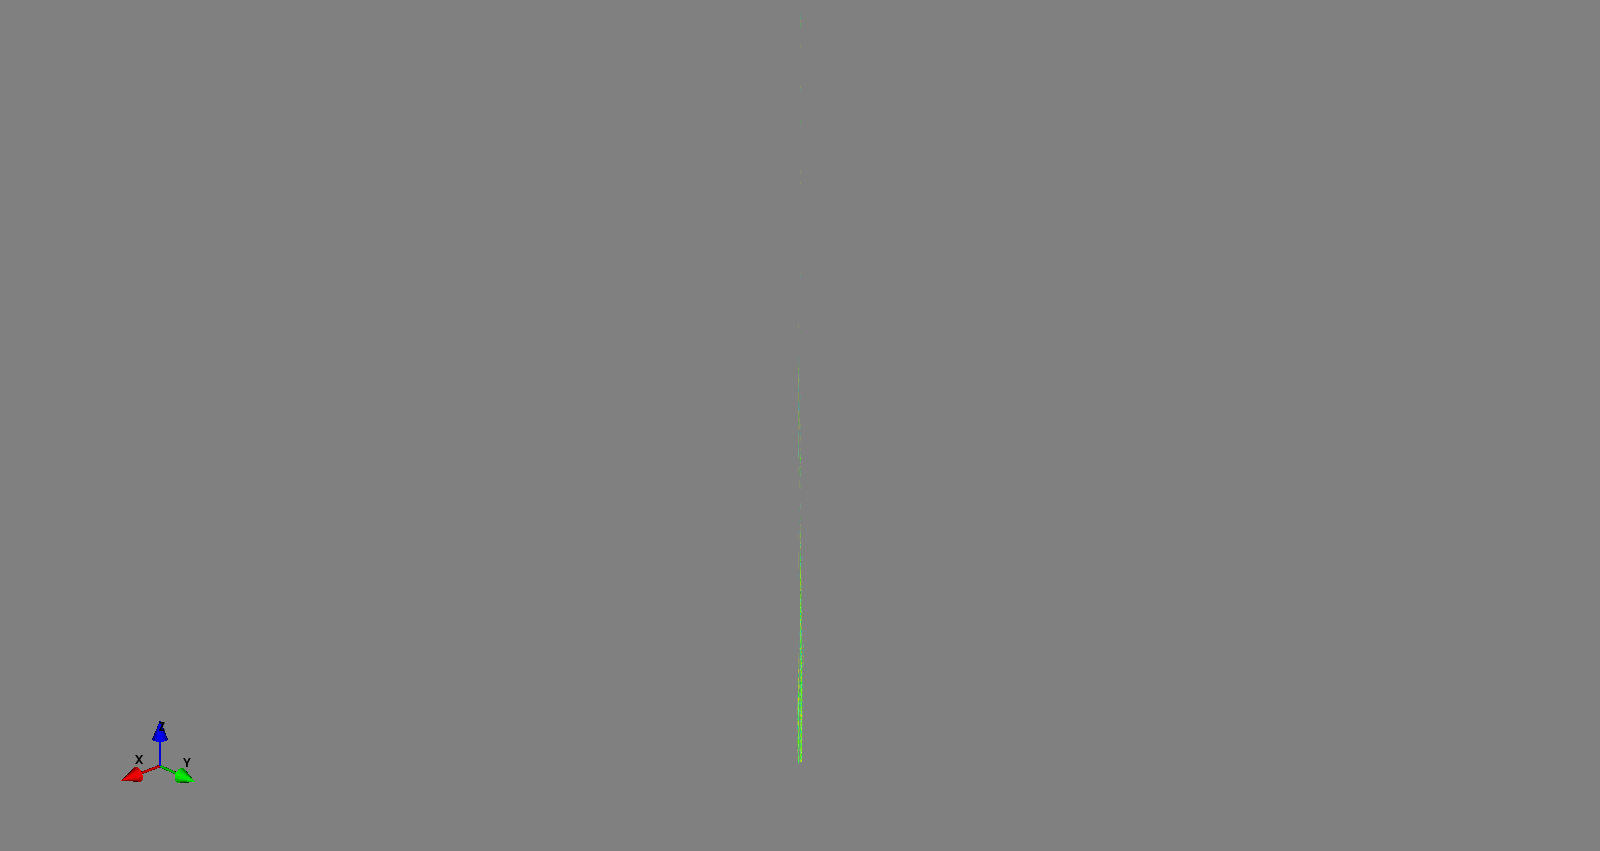
Unable to display axis or my mayavi 3d plot
- Dominant language
- Python
- Stars
- 1.4k
- Forks
- 316
- Avg merge
- 7h 44m
- Merged PRs (30d)
- 5
Description
I am a Mayavi newbie and I am using the latest version to make a python contour 3d plot. I have radar data in the following shape -longitude(2579,49,176),latitude(2579,49,176),height(2579,49,176) and reflectivity volume is the same shape as the other three. First of all I have 32 GB as RAM and the script loads up in no time. But what I see is just not clear. I am not sure how to display the three axes. A lot of the data I have is zeros. So maybe removing that may help. Apologies if the question appears too basic or I should ask this question elsewhere. I am running VTK 8.1 and Python3.5, PyQT 4.x
Here is the basic code that I am using -
mlab.contour3d(lon,lat,z,refl)
mlab.show()
Contributor guide
No contributing guide indexed for this repository
Assessment
This issue has not been assessed yet.