Flipping axis for a bar plot does not flip the data
- Dominant language
- Python
- Stars
- 305
- Forks
- 97
- PR merge metrics
- No merged PRs in 30d
Description
When plotting a bar plot and flipping one of the axes, the axis marking is flipped but the data is not.
One can compare the bar plot with a line plot, which I believe does the right thing.
I have tried the combination of `origin="top left"` and `origin="bottom right"` and both have the same problem.
**Reproduction Steps:**
```python
from functools import partial
from chaco.api import Plot, PlotAxis, create_bar_plot, create_line_plot
from enable.api import Component, ComponentEditor
import numpy
from traits.api import Instance, HasTraits
from traitsui.api import View, Item, Group
class LineAndBarPlot(HasTraits):
plot = Instance(Component)
traits_view = View(
Group(
Item('line_plot', editor=ComponentEditor()),
Item('bar_plot', editor=ComponentEditor()),
),
width=700, height=600, resizable=True
)
def create_plot(create_plot_func):
x = numpy.arange(10.0)
y = x*5.0
plot = create_plot_func(
data=(x, y), add_grid=True, add_axis=True,
orientation="v")
plot.padding = [50]*4
plot.origin = "top left"
plot.underlays.append(PlotAxis(
orientation="left",
mapper=plot.y_mapper,
title="y",
component=plot,
))
plot.underlays.append(PlotAxis(
orientation="bottom",
mapper=plot.x_mapper,
title="x",
component=plot,
))
return plot
viewer = LineAndBarPlot()
bar_plot_func = partial(create_bar_plot, bar_width=0.1)
viewer.bar_plot = create_plot(bar_plot_func)
viewer.line_plot = create_plot(create_line_plot)
viewer.configure_traits()
```
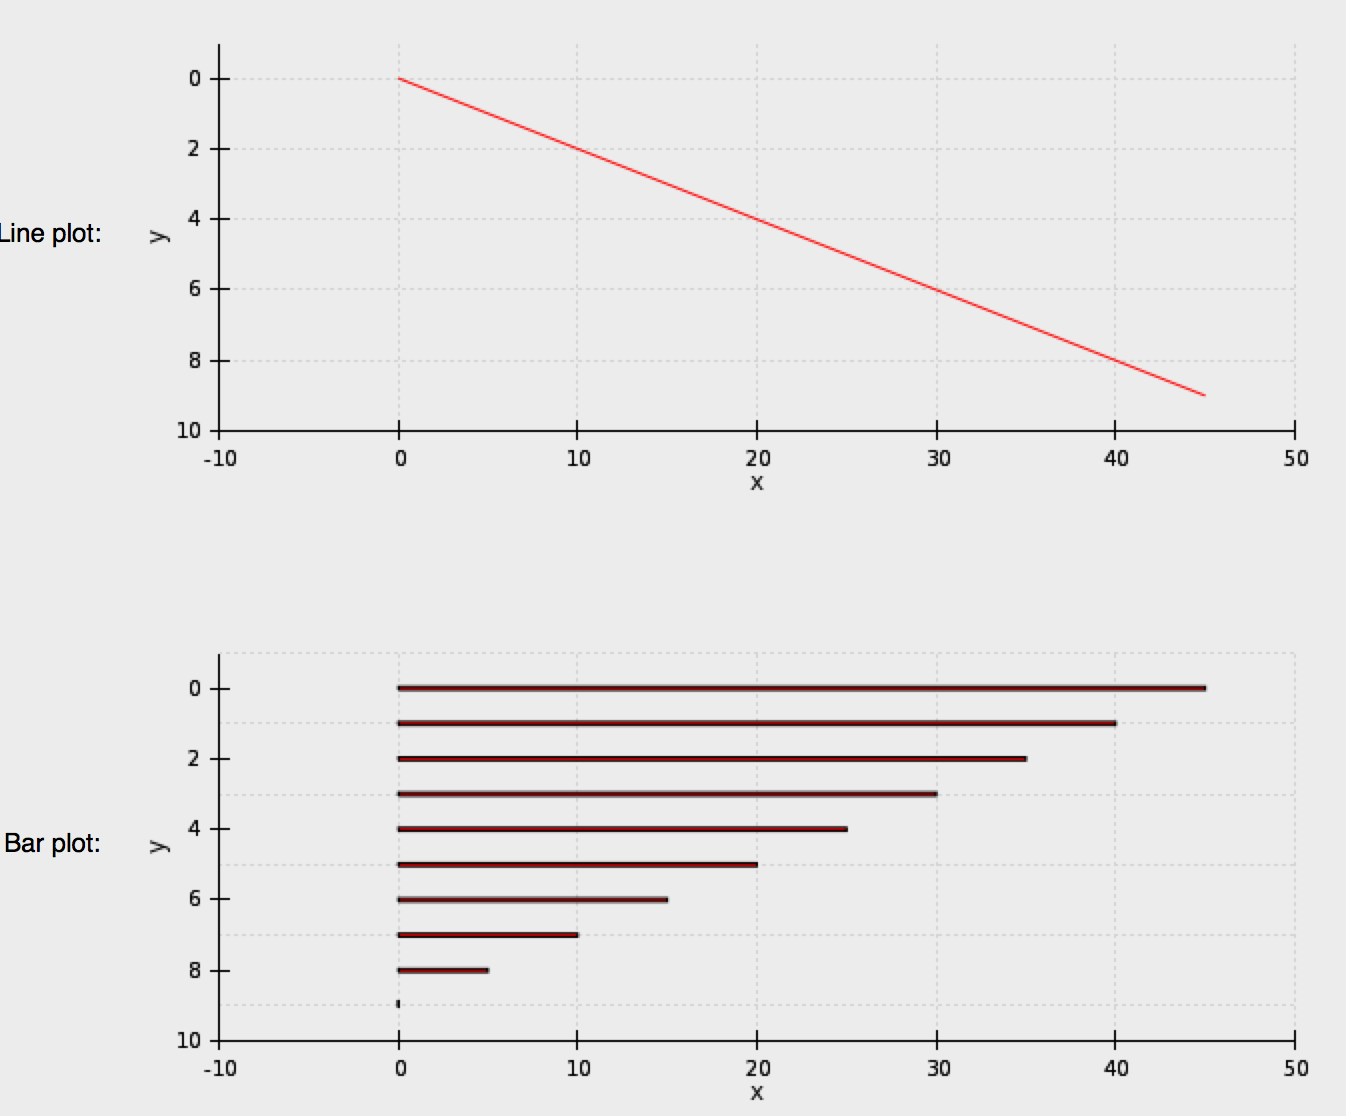
**Expected behavior:**
I will expect the bar plot to look like the line plot, just using bar instead of lines.
**OS, Python version:**
Python 2.7 on Windows 7 and OSX 10.11
Contributor guide
No contributing guide indexed for this repository
Assessment
This issue has not been assessed yet.