Not all data are displayed by bar graph
- Dominant language
- Python
- Stars
- 305
- Forks
- 97
- PR merge metrics
- No merged PRs in 30d
Description
**Problem Description**
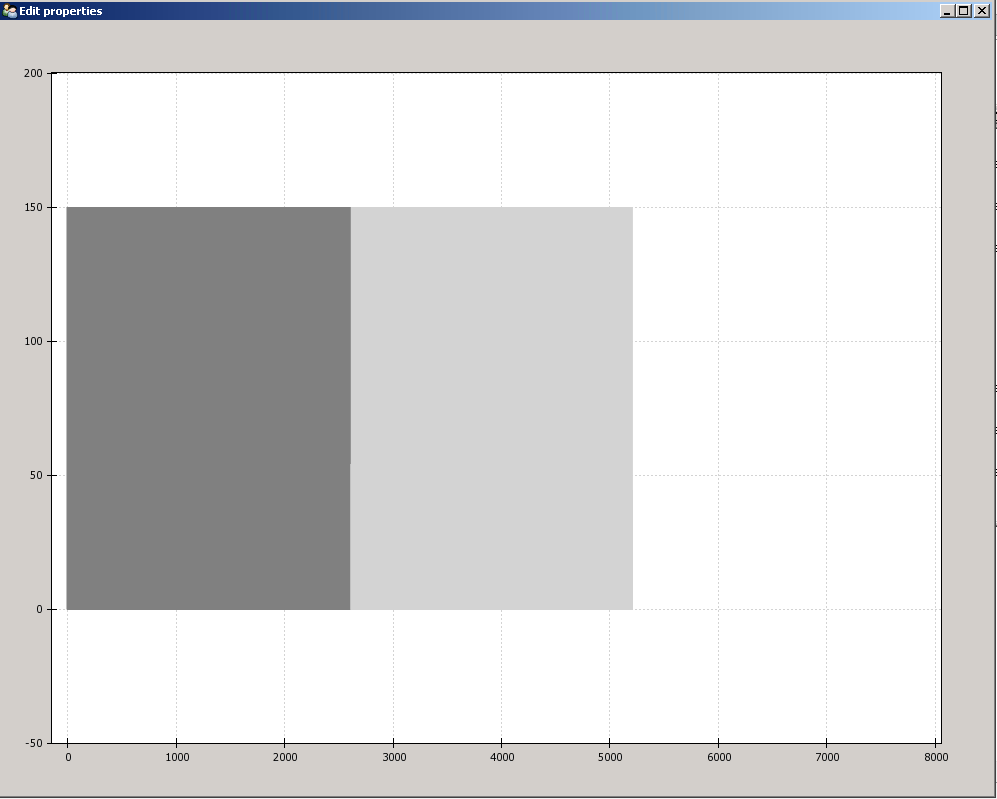
With creating simple bar plot with chaco strange behavior is occured: half of plot is filled with line_color, another one with fill_color and the last one is not drawn at all (view screenshot). With using small values it works fine (for example using 50 instead of 150 for y values).
**Reproduction Steps:**
Start program
```python
from enable.api import ComponentEditor
from traits.api import Instance, HasStrictTraits
from traitsui.api import View, UItem
from chaco.api import Plot, ArrayPlotData
class TestPlot(HasStrictTraits):
plot = Instance(Plot)
traits_view = View(UItem('plot', editor=ComponentEditor()),
width=1000, height=800, resizable=True,)
def __init__(self, **kw):
super(TestPlot, self).__init__(**kw)
plot_data = ArrayPlotData(x=list(xrange(0, 7000)), y=[150] * 7000)
self.plot = Plot(plot_data)
self.plot.plot(('x', 'y'), type='bar', line_color="gray", fill_color="lightgray")
self.plot.index_mapper.range.set(low=0 - 150, high=8000 + 50)
self.plot.value_mapper.range.set(low=0 - 50, high=100 + 100)
test = TestPlot()
if __name__ == "__main__":
test.configure_traits()
```
**Expected behavior:**
Data from 0 to 7000 for x and from 0 to 150 for y should be displayed and filled with line_color
**OS, Python version:**
Win7, python 2.7
Contributor guide
No contributing guide indexed for this repository
Assessment
This issue has not been assessed yet.