Stackplots
Open
- Dominant language
- Rust
- Stars
- 468
- Forks
- 108
- Avg merge
- 15m
- Merged PRs (30d)
- 3
Description
I want to draw a [stackplot](https://matplotlib.org/stable/gallery/lines_bars_and_markers/stackplot_demo.html#sphx-glr-gallery-lines-bars-and-markers-stackplot-demo-py) in `Plot` widget, which may look like this:
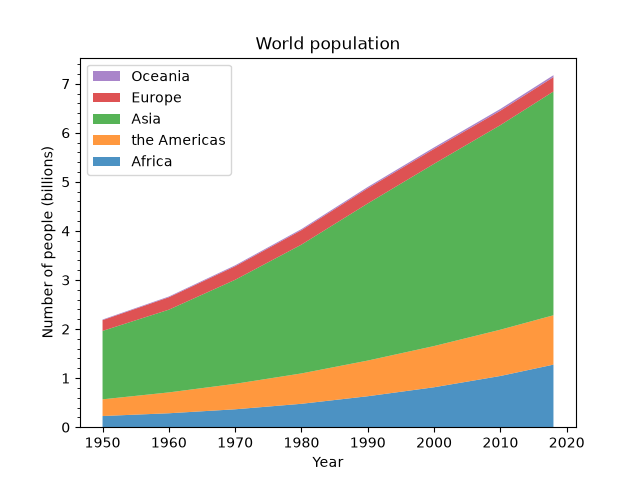
But for filling there is only options to fill for convex polygon or under graph with fixed offset.
I think, to make this, there should be something like `Line::fill_between(graph_under)`.
Contributor guide
Assessment
This issue has not been assessed yet.