elementary / elementary/appcenter-dashboard
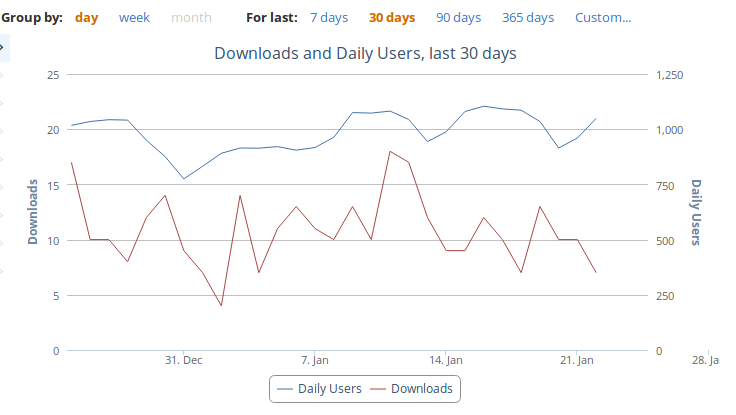
Add downloads chart
- Dominant language
- Elixir
- Stars
- 14
- Forks
- 5
- Avg merge
- 23h 19m
- Merged PRs (30d)
- 1
Description
I think, that graphical representation of frequency of downloads is more informative.
Example from Firefox Add-on Dashboard.
---
Want to back this issue? **[Post a bounty on it!](https://www.bountysource.com/issues/54179377-add-downloads-chart?utm_campaign=plugin&utm_content=tracker%2F27692469&utm_medium=issues&utm_source=github)** We accept bounties via [Bountysource](https://www.bountysource.com/?utm_campaign=plugin&utm_content=tracker%2F27692469&utm_medium=issues&utm_source=github).
Contributor guide
Research direction
No files, tests, or entry points are named. Start by locating where download statistics are collected and where the dashboard renders them, then compare the available data with the linked Firefox Add-on Dashboard example. Done means agreeing on the chart's scope and displaying download frequency clearly.
Written by the indexing model from the issue text.
Assessment
- Tech stack
- elixir
- Domain
- analytics, data-visualization
- Issue type
- Feature
- Difficulty
- 5/5
- Estimated time
- Over a week
- Activity status
- Stale
- Clarity
- Needs clarification
- Newbie friendliness
- 35/100