CEF module: no data in kibana?
- Dominant language
- Java
- Stars
- 14.9k
- Forks
- 3.5k
- Avg merge
- 1d 4h
- Merged PRs (30d)
- 88
Description
* Fresh build of Logstash master (7733dd0f862b42c68ceba884ce5cbdffa759f829)
* Elasticsearch 5.4.0
* Kibana 5.4.1
Fresh start: purge Elasticsearch `data` directory.
Start Elasticsearch, start Kibana, and start Logstash.
Health check: Logstash appears to dump a bunch of things into .kibana:
```
% curl -s 'localhost:9200/.kibana/_search?size=10' | jq '.hits.hits[]._source.title'
null
"cef-*"
null
"[CEF] Network Overview Dashboard"
"Application Protocols"
"Bandwidth Utilization"
"Destination Locations"
"Events Average by Sources"
"Event Averages by Outcome"
"Bandwidth Overview"
```
Setup seems OK.
Try to add data:
```
% telnet localhost 5000
CEF:0|security|threatmanager|1.0|100|trojan successfully stopped|10|src=10.0.0.192 dst=12.121.122.82 spt=1232
```
(The above was copied from the [cef codec specs](https://github.com/logstash-plugins/logstash-codec-cef/blob/master/spec/codecs/cef_spec.rb#L336))
Check if it's in Elasticsearch:
```
% curl -s localhost:9200/cef-*/_search | jq '.hits.hits[]._source'
{
"severity": "10",
"sourcePort": "1232",
...
"@timestamp": "2017-06-06T20:51:49.963Z",
"port": 43982,
...
```
Looks ok so far.
Now load things in Kibana, and I don't see anything in the `discover` pane:
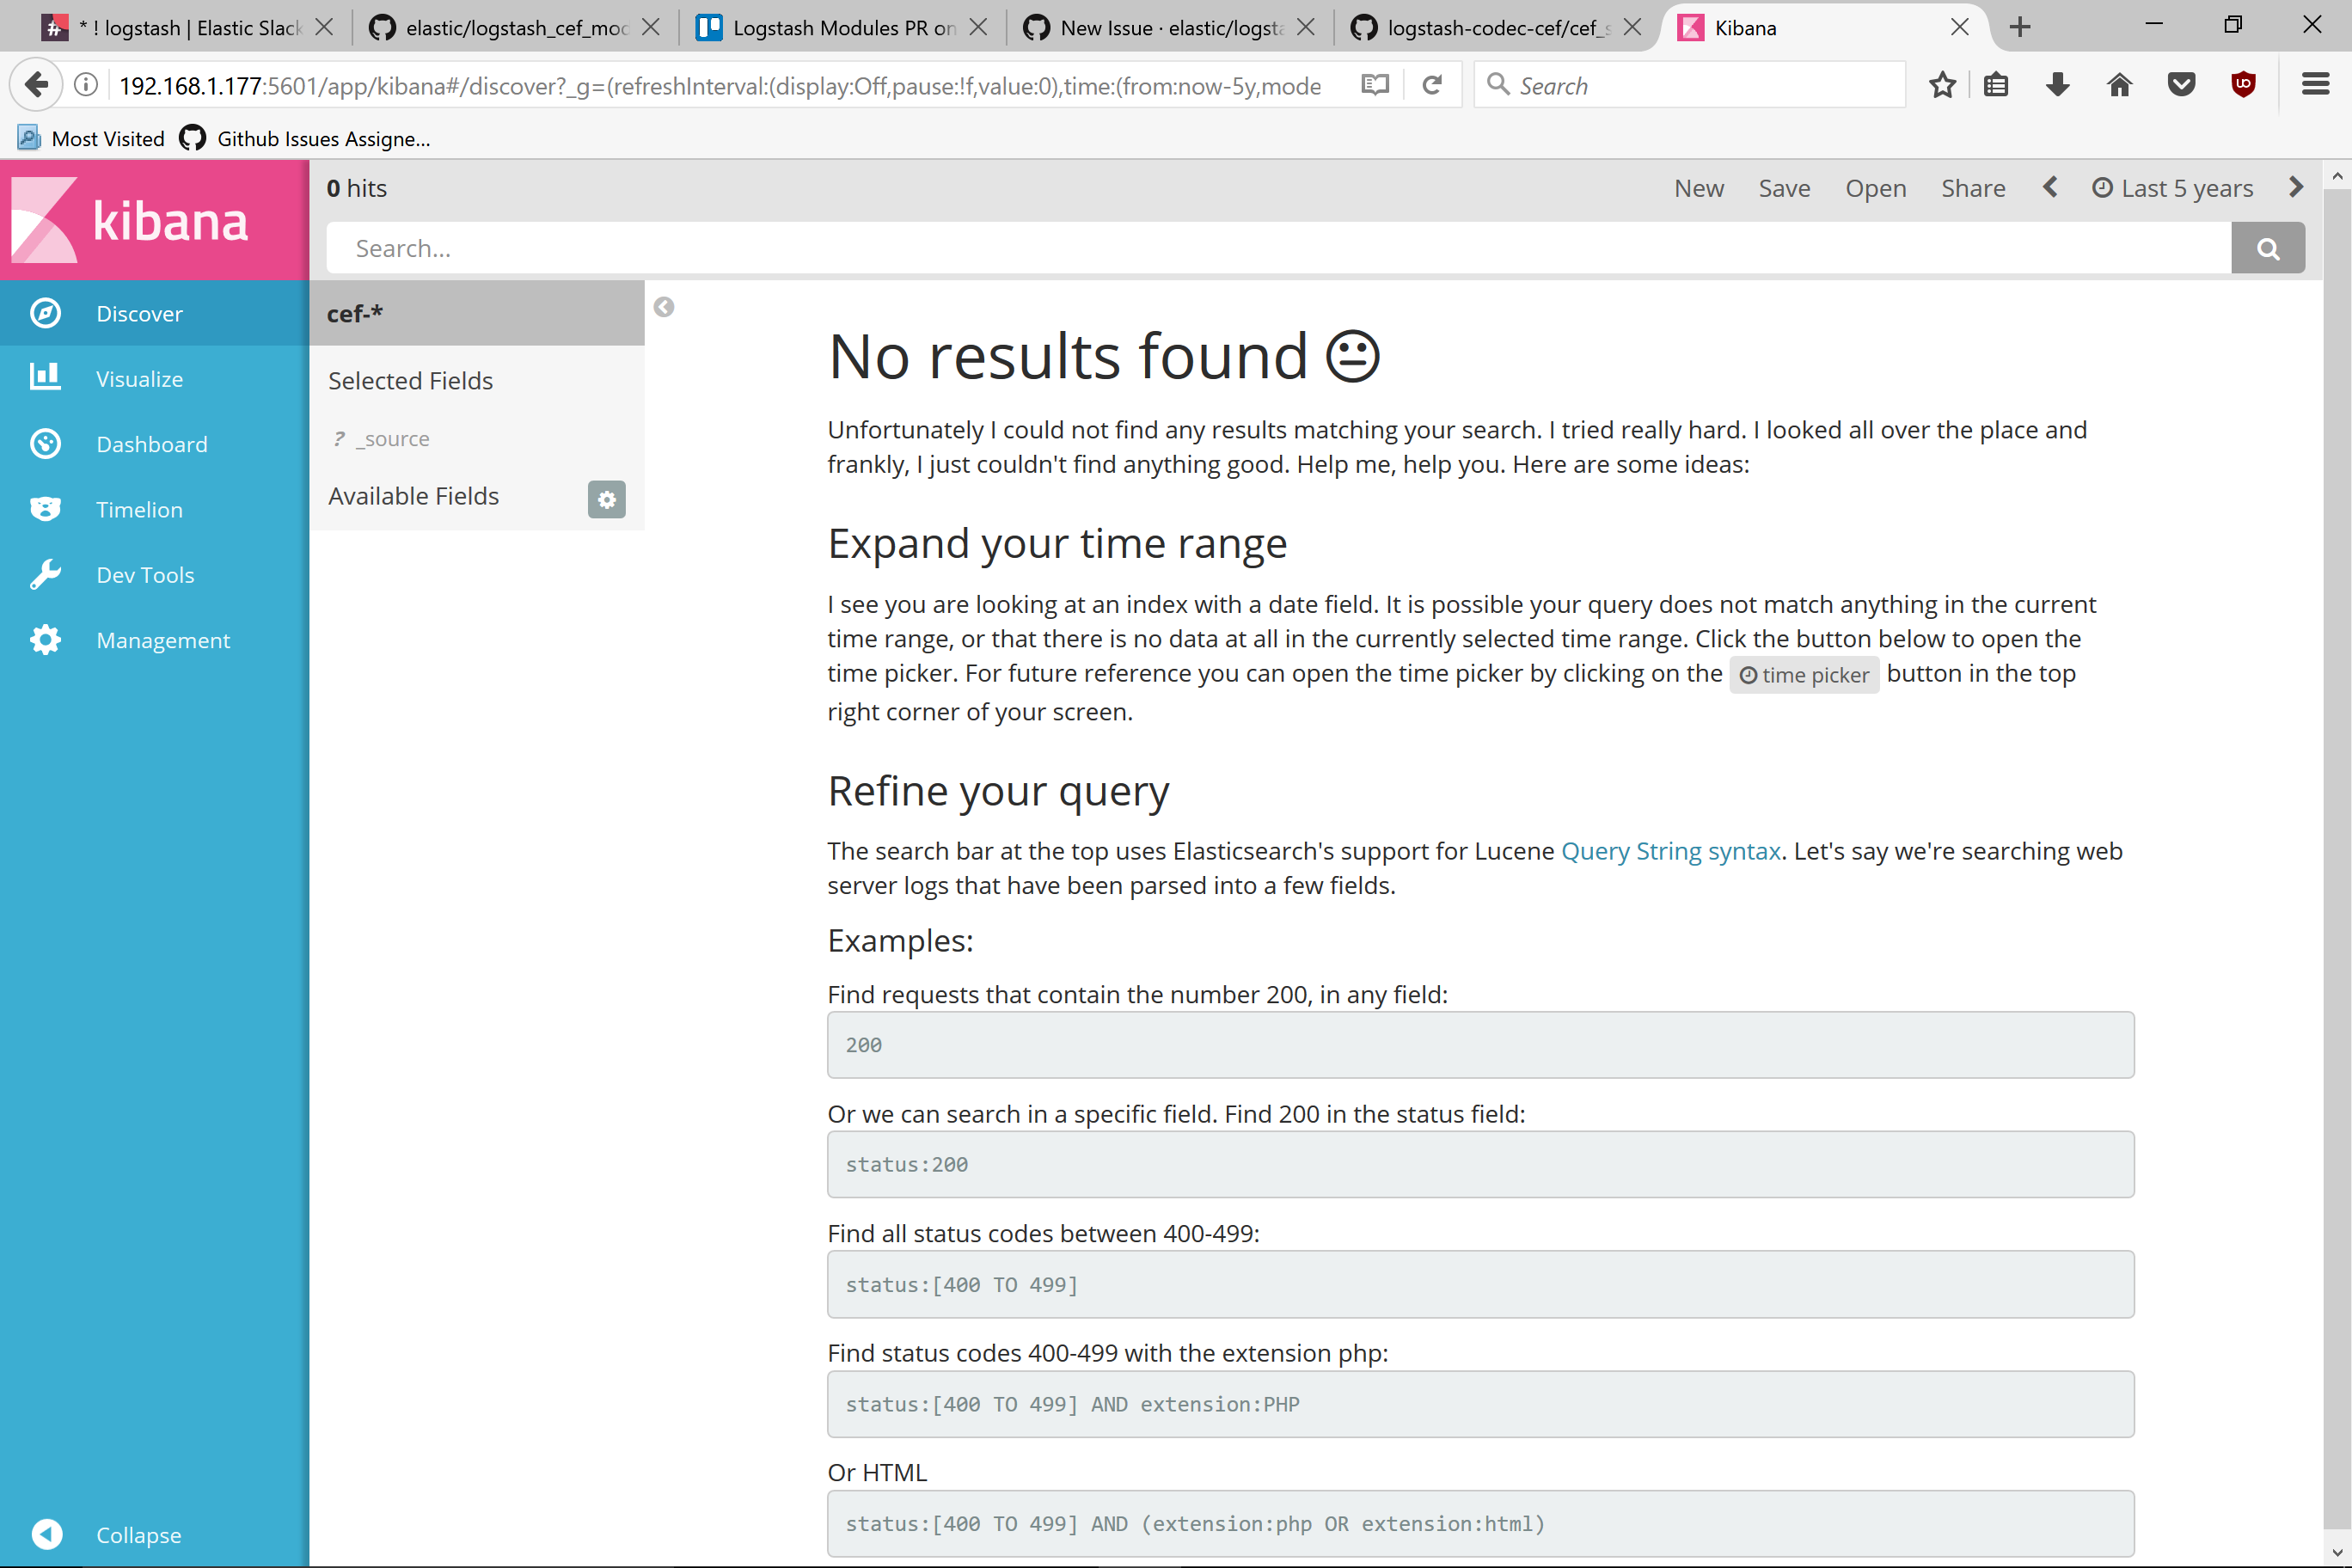
ngrep to see the query kibana sends:
```
T 127.0.0.1:35784 -> 127.0.0.1:9200 [AP]
POST /_msearch HTTP/1.1.
x-forwarded-for: 192.168.1.121.
x-forwarded-port: 57237.
x-forwarded-proto: http.
content-type: application/x-ndjson.
Host: localhost:9200.
Connection: close.
Transfer-Encoding: chunked.
.
430.
{"index":["cef-*"],"ignore_unavailable":true,"preference":1496781337560}
{"version":true,"size":500,"sort":[{"deviceReceiptTime":{"order":"desc","unmapped_type":"boolean"}}],"_source":{"excludes":[]},"aggs":{"2":{"date_histogram":{"field":"deviceReceiptTime","interval":"1M","time_zone":"America/Los_Angeles","min_doc_count":1}}},"query":{"bool":{"must":[{"match_all":{}},{"range":{"deviceReceiptTime":{"gte":1339016144356,"lte":1496782544356,"format":"epoch_millis"}}}],"must_not":[]}},"stored_fields":["*"],"script_fields":{},"docvalue_fields":["flexDate1","oldFileModificationTime","fileCreateTime","startTime","oldFileCreateTime","@timestamp","fileModificationTime","endTime","deviceReceiptTime","agentReceiptTime","deviceCustomDate2","deviceCustomDate1"],"highlight":{"pre_tags":["@kibana-highlighted-field@"],"post_tags":["@/kibana-highlighted-field@"],"fields":{"*":{"highlight_query":{"bool":{"must":[{"match_all":{}},{"range":{"deviceReceiptTime":{"gte":1339016144356,"lte":1496782544356,"format":"epoch_millis"}}}],"must_not":[]}}}},"fragment_size":2147483647}}
```
Response:
```
HTTP/1.1 200 OK.
content-type: application/json; charset=UTF-8.
content-length: 188.
.
{"responses":[{"took":10,"timed_out":false,"_shards":{"total":5,"successful":5,"failed":0},"hits":{"total":0,"max_score":null,"hits":[]},"aggregations":{"2":{"buckets":[]}},"status":200}]}
```
The query appears to focus on `deviceReceiptTime` and not `@timestamp`. The CEF codec is not providing this value by default: https://github.com/logstash-plugins/logstash-codec-cef/search?q=%22deviceReceiptTime%22&type=Code&utf8=%E2%9C%93
Contributor guide
Assessment
This issue has not been assessed yet.