elastic / elastic/apm-agent-python
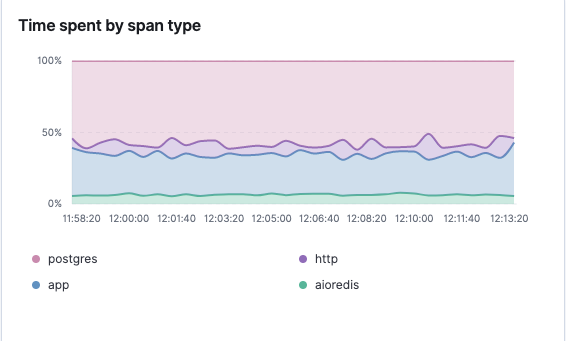
Time spent by span type to show external calls, not group on http
- Dominant language
- Python
- Stars
- 431
- Forks
- 239
- Avg merge
- 5d 10h
- Merged PRs (30d)
- 7
Description
**Is your feature request related to a problem? Please describe.**
We work on microservice-based architecture where one service might be calling 3-4 other services. All these calls are getting logged in APM span but are grouped under `http`
**Describe the solution you'd like**
If one service is calling 2 other services or some external API calls like google API etc then they must be a part of the graph that shows time spent by each span. The same information should be available at the transaction level as well to identify anomalies due to calls from internal or external calls.
Currently, there is no way to know which API call was responsible for increased response time. The same information is also not available at Kibana Lens since elastic APM does not bind the transaction name with the request but the transaction id.
**Additional context**
below is an example of a service that makes calls to 11 internal/external calls. But from the graph attached these all are grouped under HTTP. So far what I have understood is that calls are grouped under sub_type of a transacton.
Contributor guide
Assessment
This issue has not been assessed yet.