eclipse-jdt / eclipse-jdt/eclipse.jdt.debug
Wrong editor used when opening debug-frame for classfile.
- Dominant language
- Java
- Stars
- 23
- Forks
- 68
- Avg merge
- 1d 4h
- Merged PRs (30d)
- 13
Description
## Description
During debugging I have often run into an issue, that the wrong editor is used when opening classfile. This happens while debugging many common libraries, such as spring-web.
Here is an example with the wrong editor while checking a spring-web class:
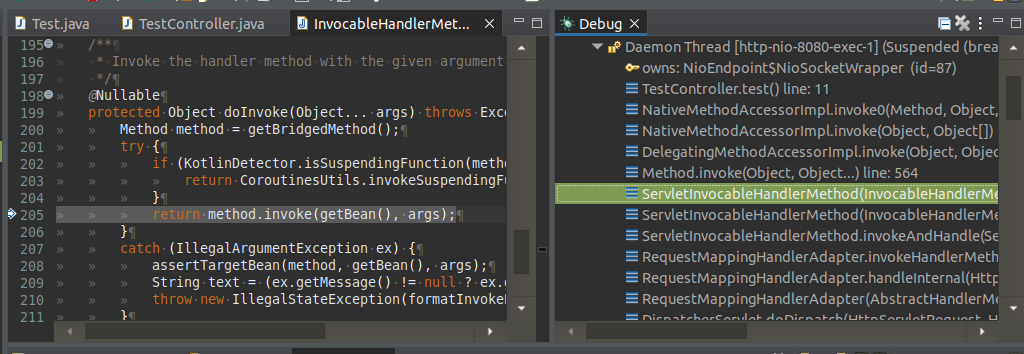
Notice that there is no (proper) syntax highlights and the the icon of the editor is an hollow J.
Also breakpoints are broken (not visible on the left) and there are other oddities when using this editor as well.
This is how it supposed to look like:
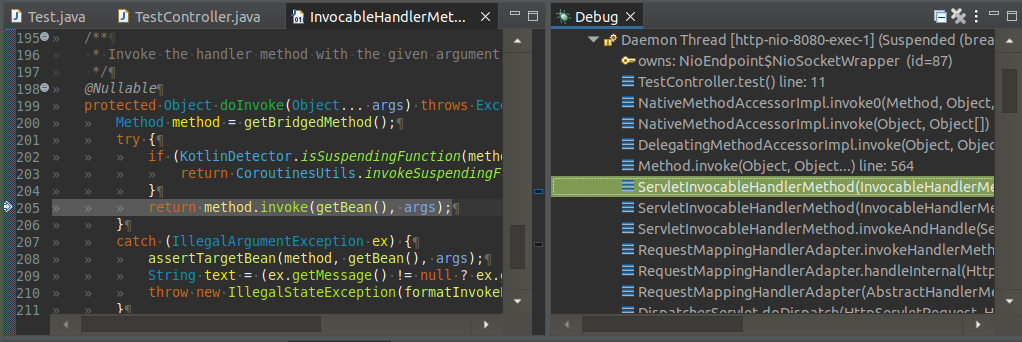
After some digging I found that the reason for this is that the first case Eclipse opens the source jar's java source code, while the second one opens the class file itself (and the ClassFileEditor attaches the proper source code).
I believe opening a java file from the source jar is never the correct behavior, the classfile editor is able to attach the source.
One workaround I found is to `right click on stacktrace -> edit source lookup -> check Search for duplicate entries on the classpath`
With this option set I get a popup every time where I can select if I want to open the classfile or Java file:
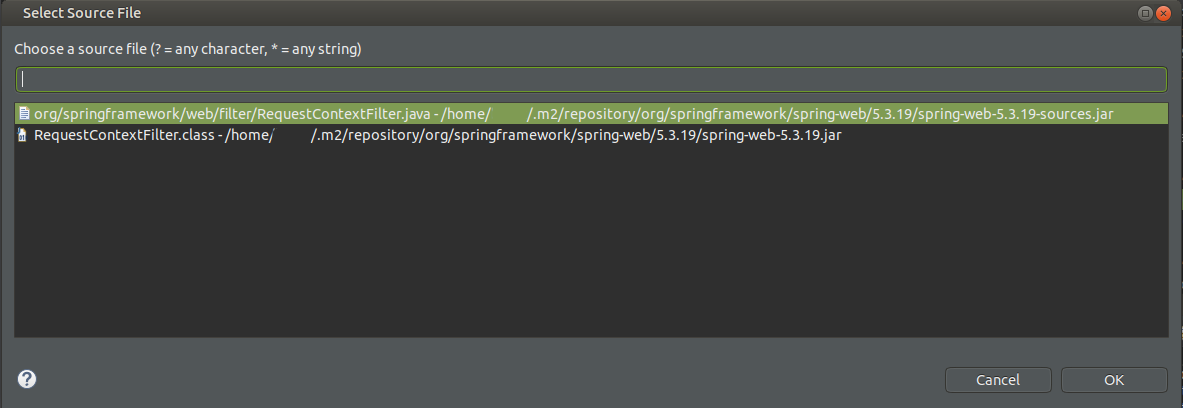
If I select the classfile everything works as expected, unfortunately I have to do this every time I'm stepping on the stacktrace or restarting debug.
This bug is only occur during debugging, hence I opened it in this project.
If I press ctrl+shift+t and search for the class that was not properly opened above (while not have already an incorrectly opened editor) it will open it properly with the classfile editor.
The bug is present in version 2022.03 and also earlier versions as well, but I'm not sure when it was introduced.
## Repro
I have created a basic Spring Boot project that can repro the issue here:
https://github.com/helospark/eclipse-debug-wrong-editor-repro
- Run Application.java main() file as a normat Java application
- Put a breakpoint into TestController.test() method
- Call http://localhost:8080/ in your browser
- Step back on the Debug view onto ServletInvocableHandlerMethod
- Notice the issues I mentioned above
I also included another main() method which shows the correct behavior in Test.java, if you step inside readValue method it is working properly.
## Expected
Always open the editor in a way that works (preferably with the classfile)
## Technical notes
`AdvancedSourceLookupDirector.initParticipants()` creates two search participant: `AdvancedSourceLookupParticipant` and `JavaSourceLookupParticipant`, from this the `JavaSourceLookupParticipant` loads the classFile and the advanced loads the java file.
AdvancedSourceLookupParticipant doesn't find the class, because AdvancedSourceLookupParticipant searches in the wrong place here:
https://github.com/eclipse-jdt/eclipse.jdt.debug/blob/0c8c6d9fa30cda3c83741613f6ea4c541c037973/org.eclipse.jdt.launching/launching/org/eclipse/jdt/launching/sourcelookup/advanced/AdvancedSourceLookupParticipant.java#L125-L130
When working (with the ObjectMapper example) the stacktrace already contains at least one entry for my project (and the target folder), so the frameLocation will be the target location which contains the external jar file.
However in case of the Spring, none of the earlier stacktrace frames contain my project, hence `projectLocator.createClasspathEntryContainer` always returns null and the code runs into:
https://github.com/eclipse-jdt/eclipse.jdt.debug/blob/0c8c6d9fa30cda3c83741613f6ea4c541c037973/org.eclipse.jdt.launching/launching/org/eclipse/jdt/launching/sourcelookup/advanced/AdvancedSourceLookupParticipant.java#L143-L148
which finds the source jar instead of the executable jar leading to the incorrect entry and duplicated source file
Contributor guide
Assessment
This issue has not been assessed yet.