Function in postmodeling to plot topk precision recall curve is only based on the threshold
- Dominant language
- Jupyter Notebook
- Stars
- 201
- Forks
- 62
- PR merge metrics
- No merged PRs in 30d
Description
https://github.com/dssg/triage/blob/e14429e734480ae30d41a962861675fe9425f2e1/src/triage/component/postmodeling/contrast/model_evaluator.py#L886-L891
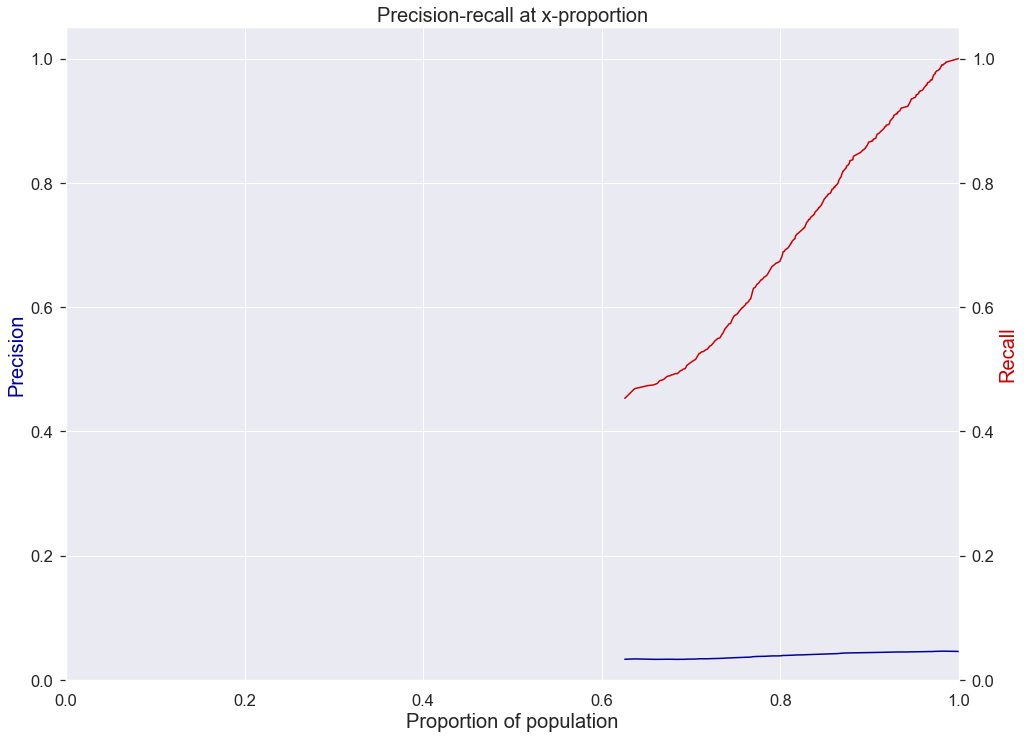
Current function `plot_precision_recall_n()` to plot top k precision/recall curve is only based on the thresholds resulted from the sklearn function `precision_recall_curve()`. For well-behaved models, it's fine because a well-behaved model normally have the score distributed from 1 and 0. However, for some baseline model eg. `PercentileRankOneFeature()` or some poor-behaved model which score distribution is concentrated between, for example, 0.3-0.0, the plot will result in some kind of cut-off because the threshold starts from 1.0, 0.99...to 0 which precision and recall will be 0.0 all the time until the threshold approaches 0.3.
This can be solved by ranking the score and the incremental k to calculate precision/recall at top k instead of iterating through the thresholds.
Contributor guide
Research direction
Start in src/triage/component/postmodeling/contrast/model_evaluator.py around lines 886-891 and inspect plot_precision_recall_n() alongside sklearn's precision_recall_curve(). Reproduce the cutoff with a concentrated score distribution such as PercentileRankOneFeature(), then verify that plotting by ranked scores and incremental k produces precision/recall across the full top-k range.
Written by the indexing model from the issue text.
Assessment
- Tech stack
- python, scikit-learn
- Domain
- data-visualization, machine-learning
- Issue type
- Bug
- Difficulty
- 3/5
- Estimated time
- 1-2 days
- Activity status
- Stale
- Clarity
- Mostly clear
- Newbie friendliness
- 45/100