dotnet / dotnet/machinelearning-modelbuilder
Forecast Prediction Data Is Different From Graph Data
- Dominant language
- Dockerfile
- Stars
- 285
- Forks
- 66
- PR merge metrics
- No merged PRs in 30d
Description
**System Information (please complete the following information):**
- Model Builder Version (available in Manage Extensions dialog): 16.13.1.2210302
- Visual Studio Version: 2022 (17.1.6)
**Describe the bug**
- On which step of the process did you run into an issue: Forecasting Prediction generates different table and graph
- Clear description of the problem:
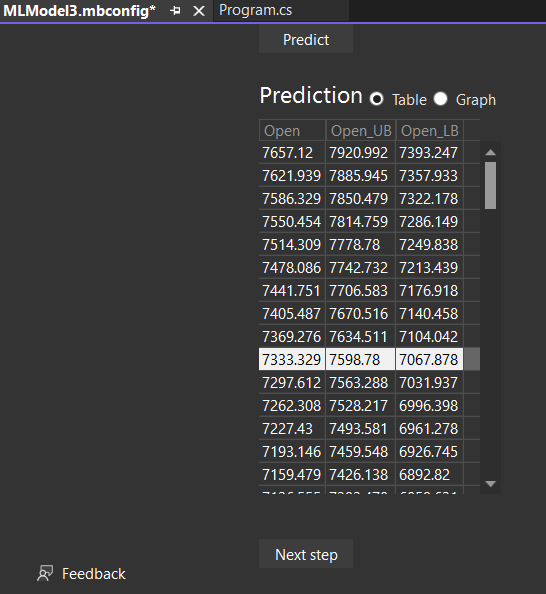
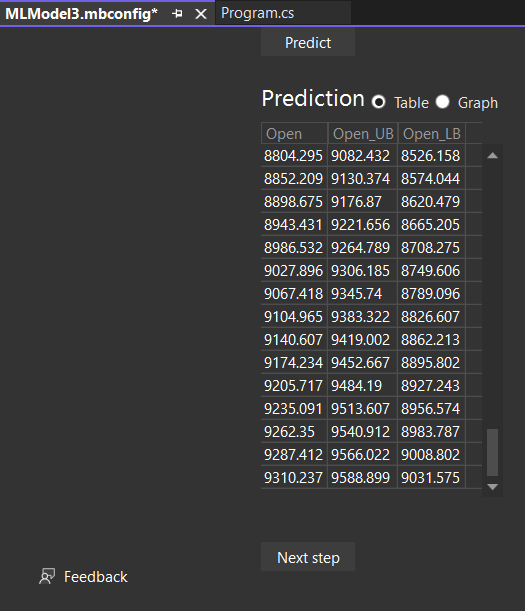
The data inside the table is different from the data on the graph
here is the table data
starting from this (from row 1)
ends here (row 100)
and this is the graph
(its weird because it ends at row 98 not 100)
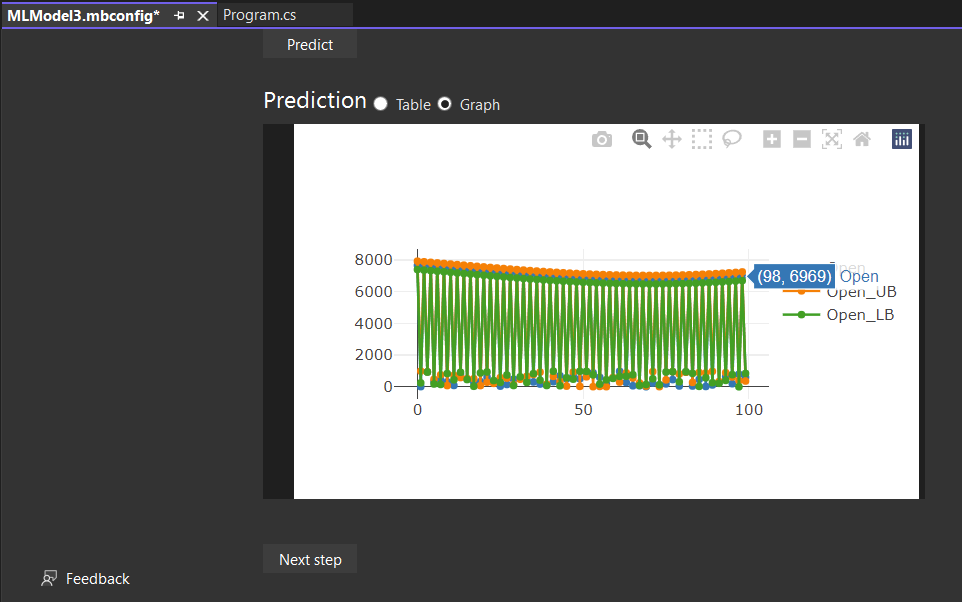
The last "Open" value was suppose to be 9310.237, but in the graph it was 6969
**To Reproduce**
Steps to reproduce the behavior:
1. Train the model
2. Evaluate the model
**Expected behavior**
I expect the data in the table match with the data from the graph. I do not know which prediction is the correct one. Is it the table data or the graph data, because both represents different outcome.
**Screenshots**
Screenshots are at the links above
**Additional context**
Here is my data for training
[stocks.csv](https://github.com/dotnet/machinelearning-modelbuilder/files/8683898/stocks.csv)
Contributor guide
No contributing guide indexed for this repository
Assessment
This issue has not been assessed yet.