dotnet-trace does not resolve symbols on linux-arm
- Dominant language
- C++
- Stars
- 1.3k
- Forks
- 404
- Avg merge
- 2d 5h
- Merged PRs (30d)
- 35
Description
I want to use `dotnet-trace` on `linux-arm` (ARMv7-A 32Bit) to analyse my application, but the symbols/names of my application are not resolved for some reason.
If i use `dotnet-trace` for the same application on `linux-x64` it will resolve the symbols/names just fine.
I am using `dotnet-trace` version 5.0.160202 together with `.net core 5.0.102`.
An example trace on `linux-arm` looks like this in `PerfView`:
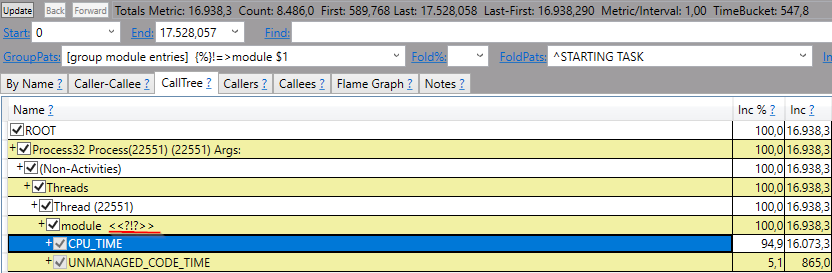
Maybe i am missing something simple and this is a problem on my side, therefore i wrote done my steps. My application `TestTrace` consists of 2 files:
Program.cs:
````
using System;
namespace TraceTest
{
class Program
{
static void Main(string[] args)
{
Console.WriteLine("DoSomething ...");
DoSomething();
Console.WriteLine("Finished!");
}
static void DoSomething()
{
for(var i = 0; i< 1_000_000_000; i++){}
}
}
}
````
TraceTest.csproj:
````
Exe
netcoreapp5.0
````
1. How i build the binaries for `linux-arm` on Windows:
````
dotnet publish --configuration Debug -r linux-arm --self-contained
````
2. I copied the whole content inside the directory `..\TraceTest\bin\Debug\netcoreapp5.0\linux-arm\publish` to `$HOME/TraceTest` on `linux-arm`
3. Install the `.net core 5.0 sdk` on `linux-arm` (all the following commands were executed as `root`):
````
wget https://download.visualstudio.microsoft.com/download/pr/726e260e-ce94-46c3-a169-57b2ebf5433d/5fb2a00b04b3509a0a6db63e302523a8/dotnet-sdk-5.0.102-linux-arm.tar.gz -O dotnet-sdk-5.0.102-linux-arm.tar.gz
mkdir -p "$HOME/dotnet" && tar zxf dotnet-sdk-5.0.102-linux-arm.tar.gz -C "$HOME/dotnet"
export DOTNET_ROOT=$HOME/dotnet
export PATH=$PATH:$HOME/dotnet
````
4. Install `dotnet-trace` on `linux-arm` (during my tests the following commands installed `dotnet-trace` version '5.0.160202'):
````
dotnet tool install --global dotnet-trace
export PATH="$PATH:/home/root/.dotnet/tools"
````
5. Collect a trace for my `TraceTest` application:
````
cd $HOME/TraceTest
chmod +x TraceTest
dotnet-trace collect -- TraceTest
````
I got the following output (i stopped the trace manually here):
````
root@myLinuxArmMachine:$HOME/TraceTest# dotnet-trace collect -- TraceTest
No profile or providers specified, defaulting to trace profile 'cpu-sampling'
Provider Name Keywords Level Enabled By
Microsoft-DotNETCore-SampleProfiler 0x0000F00000000000 Informational(4) --profile
Microsoft-Windows-DotNETRuntime 0x00000014C14FCCBD Informational(4) --profile
Process : $HOME/TraceTest/TraceTest
Output File : $HOME/TraceTest/trace.nettrace
[00:00:00:17] Recording trace 599.055 (KB)
Press or to exit...969 (KB)
Stopping the trace. This may take up to minutes depending on the application being traced.
Trace completed.
````
6. I opened the trace file `$HOME/TraceTest/trace.nettrace` on my windows machine with `PerfView`. I double-clicked on `Thread Time (with StartStop Activities) Stacks` and opened the tab `CallTree`, but there were no resolved symbols/names (see the screenshot from above).
I did the same tracing process on `linux-x64` and the symbols/names were resolved just fine:
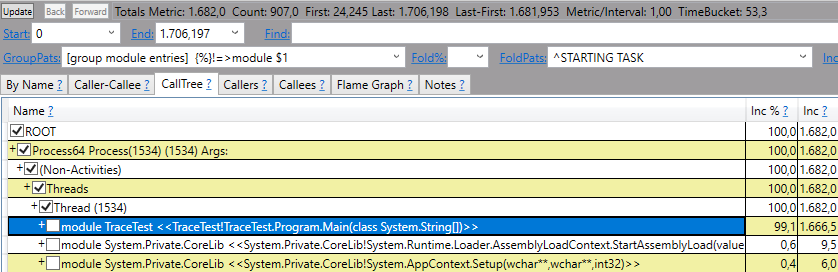
Other things i tried without success:
- Use `.net core 3.1` instead of `.net core 5.0` (so adapt the TraceTest.csproj, use the `.net core 3.1 sdk` and install `dotnet-trace` for `.net core 3.1`). I know that it is not possible to do the `dotnet-trace collect -- TraceTest` command on `.net core 3.1` (so i added a Console.ReadKey() to my Program.cs and started the application manually).
- Convert the trace to the speedscope format via `dotnet-trace convert trace.nettrace --format Speedscope --output trace.speedscope`. There are no resovled names for any frame inside the created file `trace.speedscope.json`.
In comparsion i can see some meaningful names for the fames in the converted trace of `linux-x64`. Furthermore, there are more frames in the `linux-x64` trace in general. It seems like all the different frames inside the `linux-x64` are reduced to one frame "CPU_TIME" inside the `linux-arm` trace.
- Copy the project `TestTrace` directly to `linux-arm` and execute it via `dotnet run`.
- Trace with the `PublishReadyToRun` option enabled `dotnet publish --configuration Debug -r linux-arm -p:PublishReadyToRun=true` (compiled this on linux-x64 and not on Windows)
- Do not stop the tracing manually. I always get the following error, but i do not think this should affect the tracing results:
````
[ERROR] Microsoft.Diagnostics.NETCore.Client.ServerNotAvailableException: Could not send Stop command. The target process may have exited.
at Microsoft.Diagnostics.NETCore.Client.EventPipeSession.Stop() in /_/src/Microsoft.Diagnostics.NETCore.Client/DiagnosticsClient/EventPipeSession.cs:line 62
at Microsoft.Diagnostics.Tools.Trace.CollectCommandHandler.Collect(CancellationToken ct, IConsole console, Int32 processId, FileInfo output, UInt32 buffersize, String providers, String profile, TraceFileFormat format, TimeSpan duration, String clrevents, String clreventlevel, String name, String diagnosticPort) in /_/src/Tools/dotnet-trace/CommandLine/Commands/CollectCommand.cs:line 221
````
I also searched for related problems, but i cannot find my exact problem (working fine on `linux-x64`, but not on `linux-arm`).
I hope i missing out something simple here and someone can help me.
Contributor guide
No contributing guide indexed for this repository
Assessment
This issue has not been assessed yet.