RelatedActivityIds not being collected when using dotnet-trace
- Dominant language
- C++
- Stars
- 1.3k
- Forks
- 404
- Avg merge
- 2d 5h
- Merged PRs (30d)
- 35
Description
There seems to be an issue with dotnet-trace where RelatedActivityIds are not collected, at least not for the provider Microsoft-Diagnostics-DiagnosticSource. In order to demonstrate what the events should look like I've also included instructions in the repro steps on how to collect a diagsession with the same events where the only difference in collection is that the diagsession collects using ETW (using DiagnosticSourceEventSource to forward the DiagnosticSource events from EventPipe) instead of dotnet-trace:
1) Attach to a .NET Core application (I've been using .NET Core version 3.1.300-preview-015135 for reference) that uses EF Core with a non in-memory database (I can provide an example application via email if needed) using dotnet-trace with the following command:
`dotnet-trace collect -p --providers Microsoft-Diagnostics-DiagnosticSource:00000003:5:FilterAndPayloadSpecs=\"Microsoft.EntityFrameworkCore/Microsoft.EntityFrameworkCore.Database.Transaction.TransactionStarting@Activity1Start:-TransactionId;IsAsync\r\nMicrosoft.EntityFrameworkCore/Microsoft.EntityFrameworkCore.Database.Transaction.TransactionCommitted@Activity1Stop:\r\nMicrosoft.EntityFrameworkCore/Microsoft.EntityFrameworkCore.Database.Transaction.TransactionRolledBack@Activity1Stop:\r\nMicrosoft.EntityFrameworkCore/Microsoft.EntityFrameworkCore.Database.Transaction.TransactionDisposed@Activity1Stop:-TransactionId\r\nMicrosoft.EntityFrameworkCore/Microsoft.EntityFrameworkCore.Database.Command.CommandExecuting@Activity2Start:-Command;Command.CommandText;ConnectionId;IsAsync;Command.Connection.ClientConnectionId;Command.Connection.ServerVersion;Command.CommandTimeout;Command.CommandType;Command.Connection.ConnectionString;Command.Connection.Database;Command.Connection.DataSource;Command.Connection.PacketSize\r\nMicrosoft.EntityFrameworkCore/Microsoft.EntityFrameworkCore.Database.Command.DataReaderDisposing@Activity2Stop:-CommandId;RecordsAffected;ReadCount\r\nMicrosoft.EntityFrameworkCore/Microsoft.EntityFrameworkCore.Database.Command.CommandError@Activity2Stop:-Exception\r\nSqlClientDiagnosticListener/System.Data.SqlClient.WriteCommandBefore:-OperationId;Command;Command.CommandText;ConnectionId;Operation;Command.Connection.ServerVersion;Command.CommandTimeout;Command.CommandType;Command.Connection.ConnectionString;Command.Connection.Database;Command.Connection.DataSource\r\nSqlClientDiagnosticListener/System.Data.SqlClient.WriteCommandAfter:-OperationId\r\nSqlClientDiagnosticListener/System.Data.SqlClient.WriteCommandError:-OperationId;Exception\r\nSqlClientDiagnosticListener/Microsoft.Data.SqlClient.WriteCommandBefore:-OperationId;Command;Command.CommandText;ConnectionId;Operation;Command.Connection.ServerVersion;Command.CommandTimeout;Command.CommandType;Command.Connection.ConnectionString;Command.Connection.Database;Command.Connection.DataSource\r\nSqlClientDiagnosticListener/Microsoft.Data.SqlClient.WriteCommandAfter:-OperationId\r\nSqlClientDiagnosticListener/Microsoft.Data.SqlClient.WriteCommandError:-OperationId;Exception\",System.Threading.Tasks.TplEventSource`
2) Open the nettrace in perfview
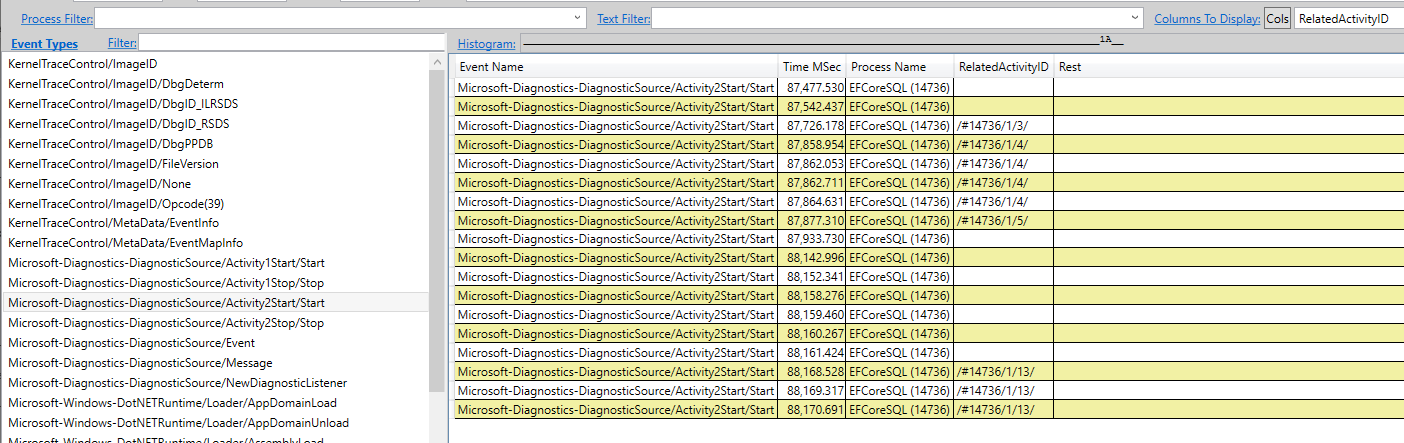
3) Note how there are no related activity ids for Microsoft-Diagnostics-DiagnosticSource/Activity2Start/Start events

4) Now using the same .NET Core application, profile the application using the database tool in Visual Studio 2019 (Debug -> Performance Profiler -> Database)
5) Save the resulting diagsession and open it in perfview
6) Note how all the events and the information for them are almost the same except that this time there are RelatedActivityIds for Microsoft-Diagnostics-DiagnosticSource/Activity2Start/Start events:
For reference when collecting with dotnet-trace you will need to use an older version of dotnet-trace (I used 3.1.57502+6767a9ac24bde3a58d7b51bdaff7c7d75aab9a65) to collect Microsoft-Diagnostics-DiagnosticSource events due to this bug: #1190
Also for additional context this bug prevents the Visual Studio Performance Profiler's database tool from providing information about database transactions when collecting with dotnet-trace which we need in order to suppot Linux (since we rely on dotnet-trace for collection on Linux).
Contributor guide
No contributing guide indexed for this repository
Assessment
This issue has not been assessed yet.