Kestrel leaves ~20% of a 24-core Linux host idle under high-concurrency HTTP/1.1 load
- Dominant language
- C#
- Stars
- 38.4k
- Forks
- 10.9k
- Avg merge
- 2d 6h
- Merged PRs (30d)
- 290
Description
### Is there an existing issue for this?
- [x] I searched both open and closed issues in `dotnet/aspnetcore` and `dotnet/runtime`.
The closest related investigations I found are dotnet/runtime#36447 (high-core-count scaling and idle CPU) and dotnet/aspnetcore#41391 (`IOQueue` scheduling tradeoffs), but neither appears to cover this reproducible case on a 24-CPU, single-NUMA-node x64 Linux desktop.
### Describe the bug
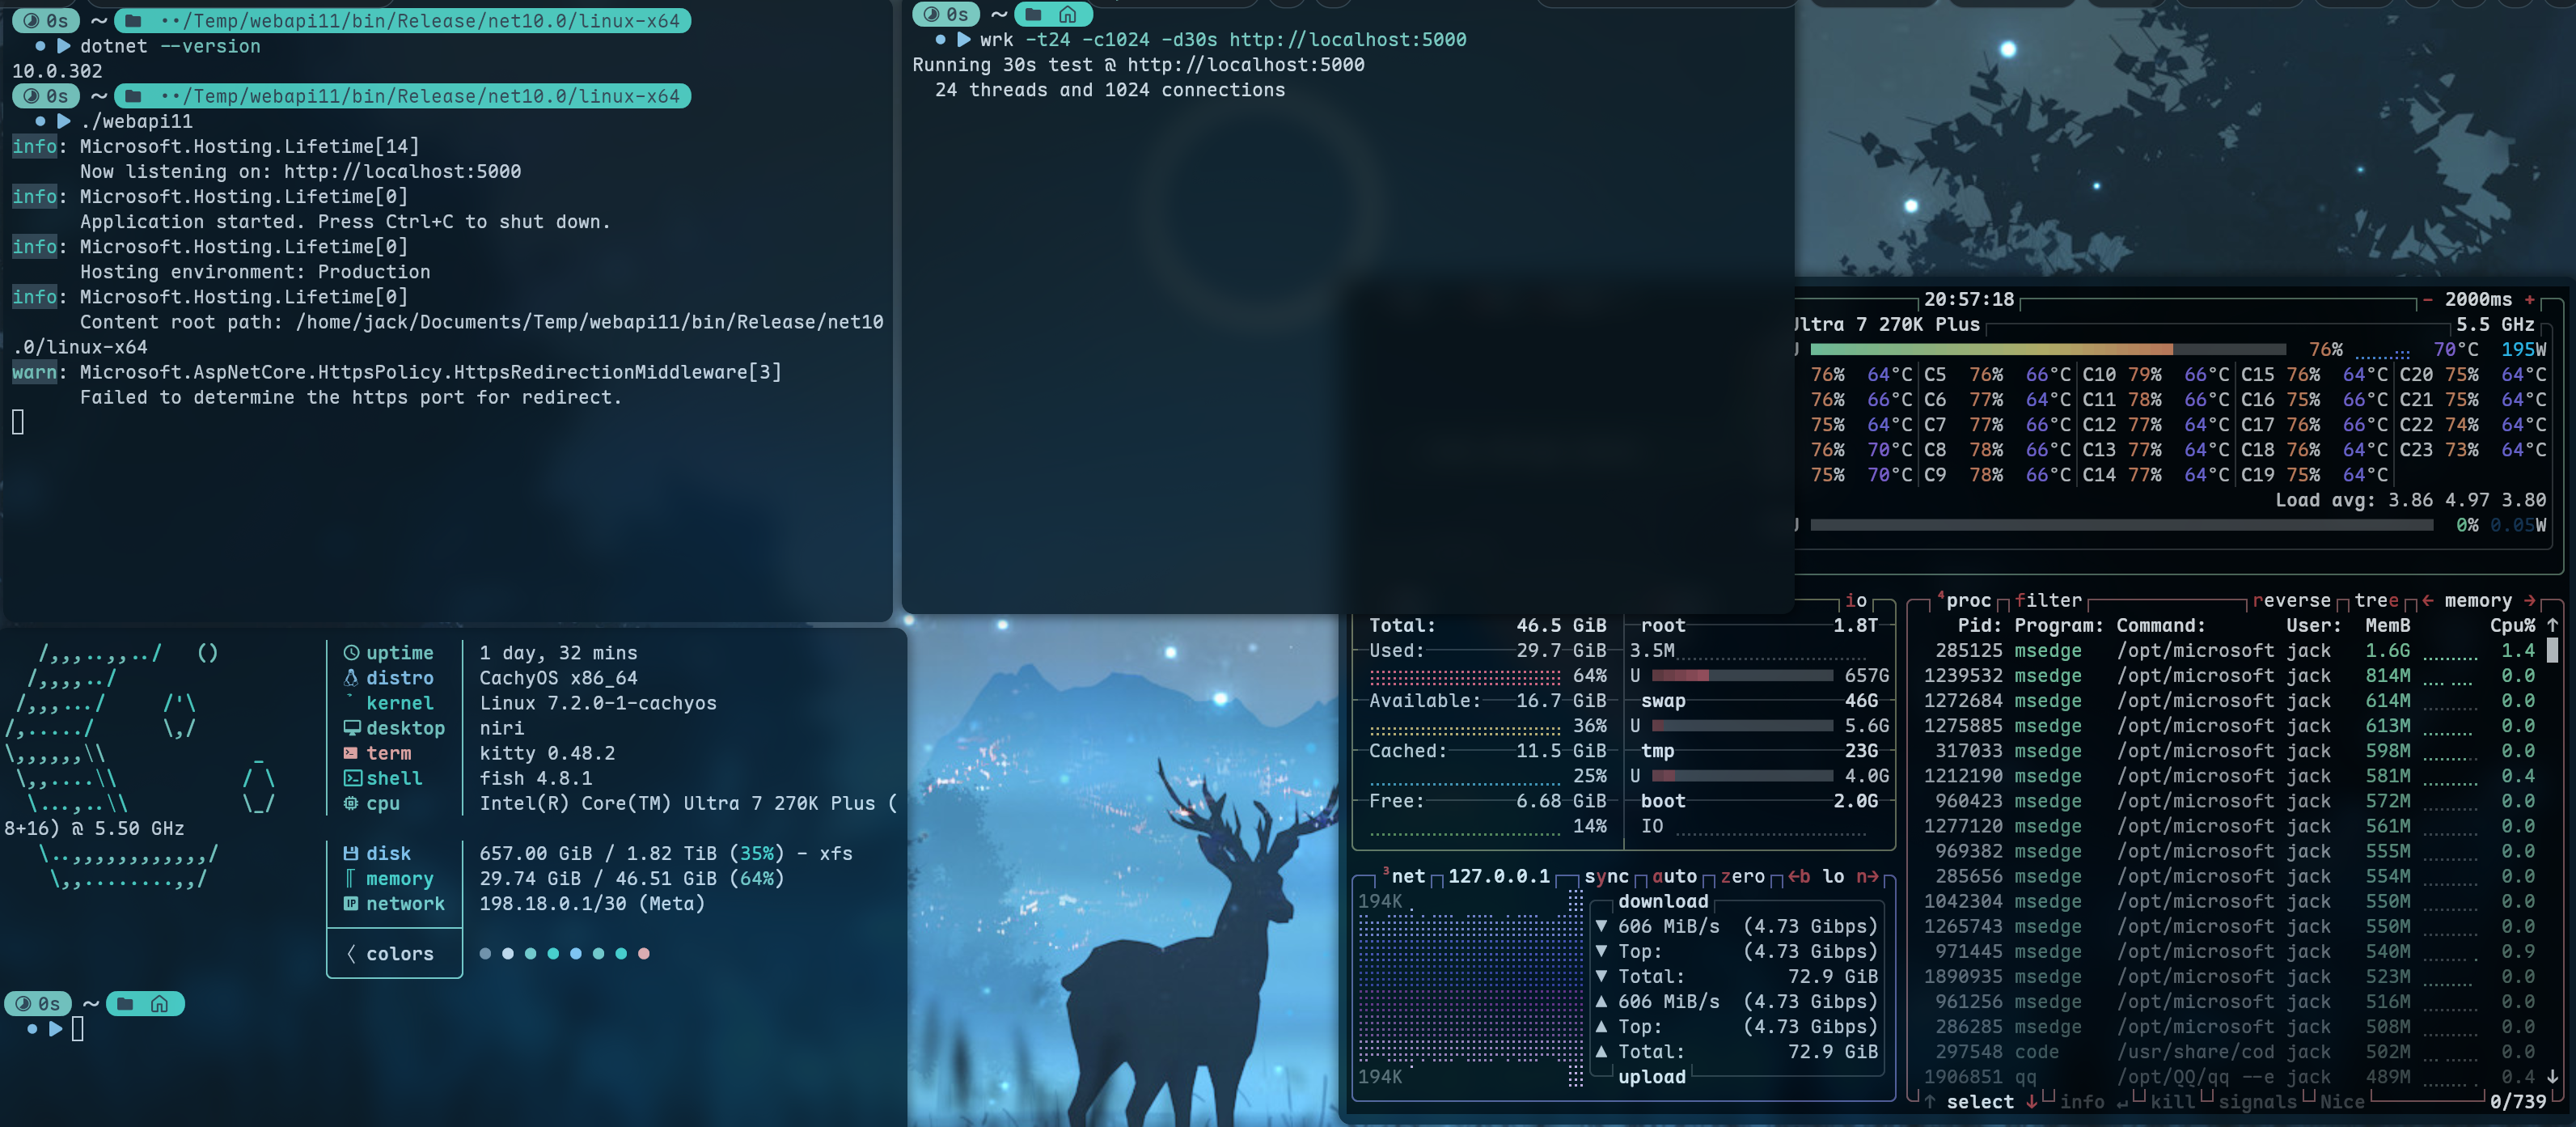
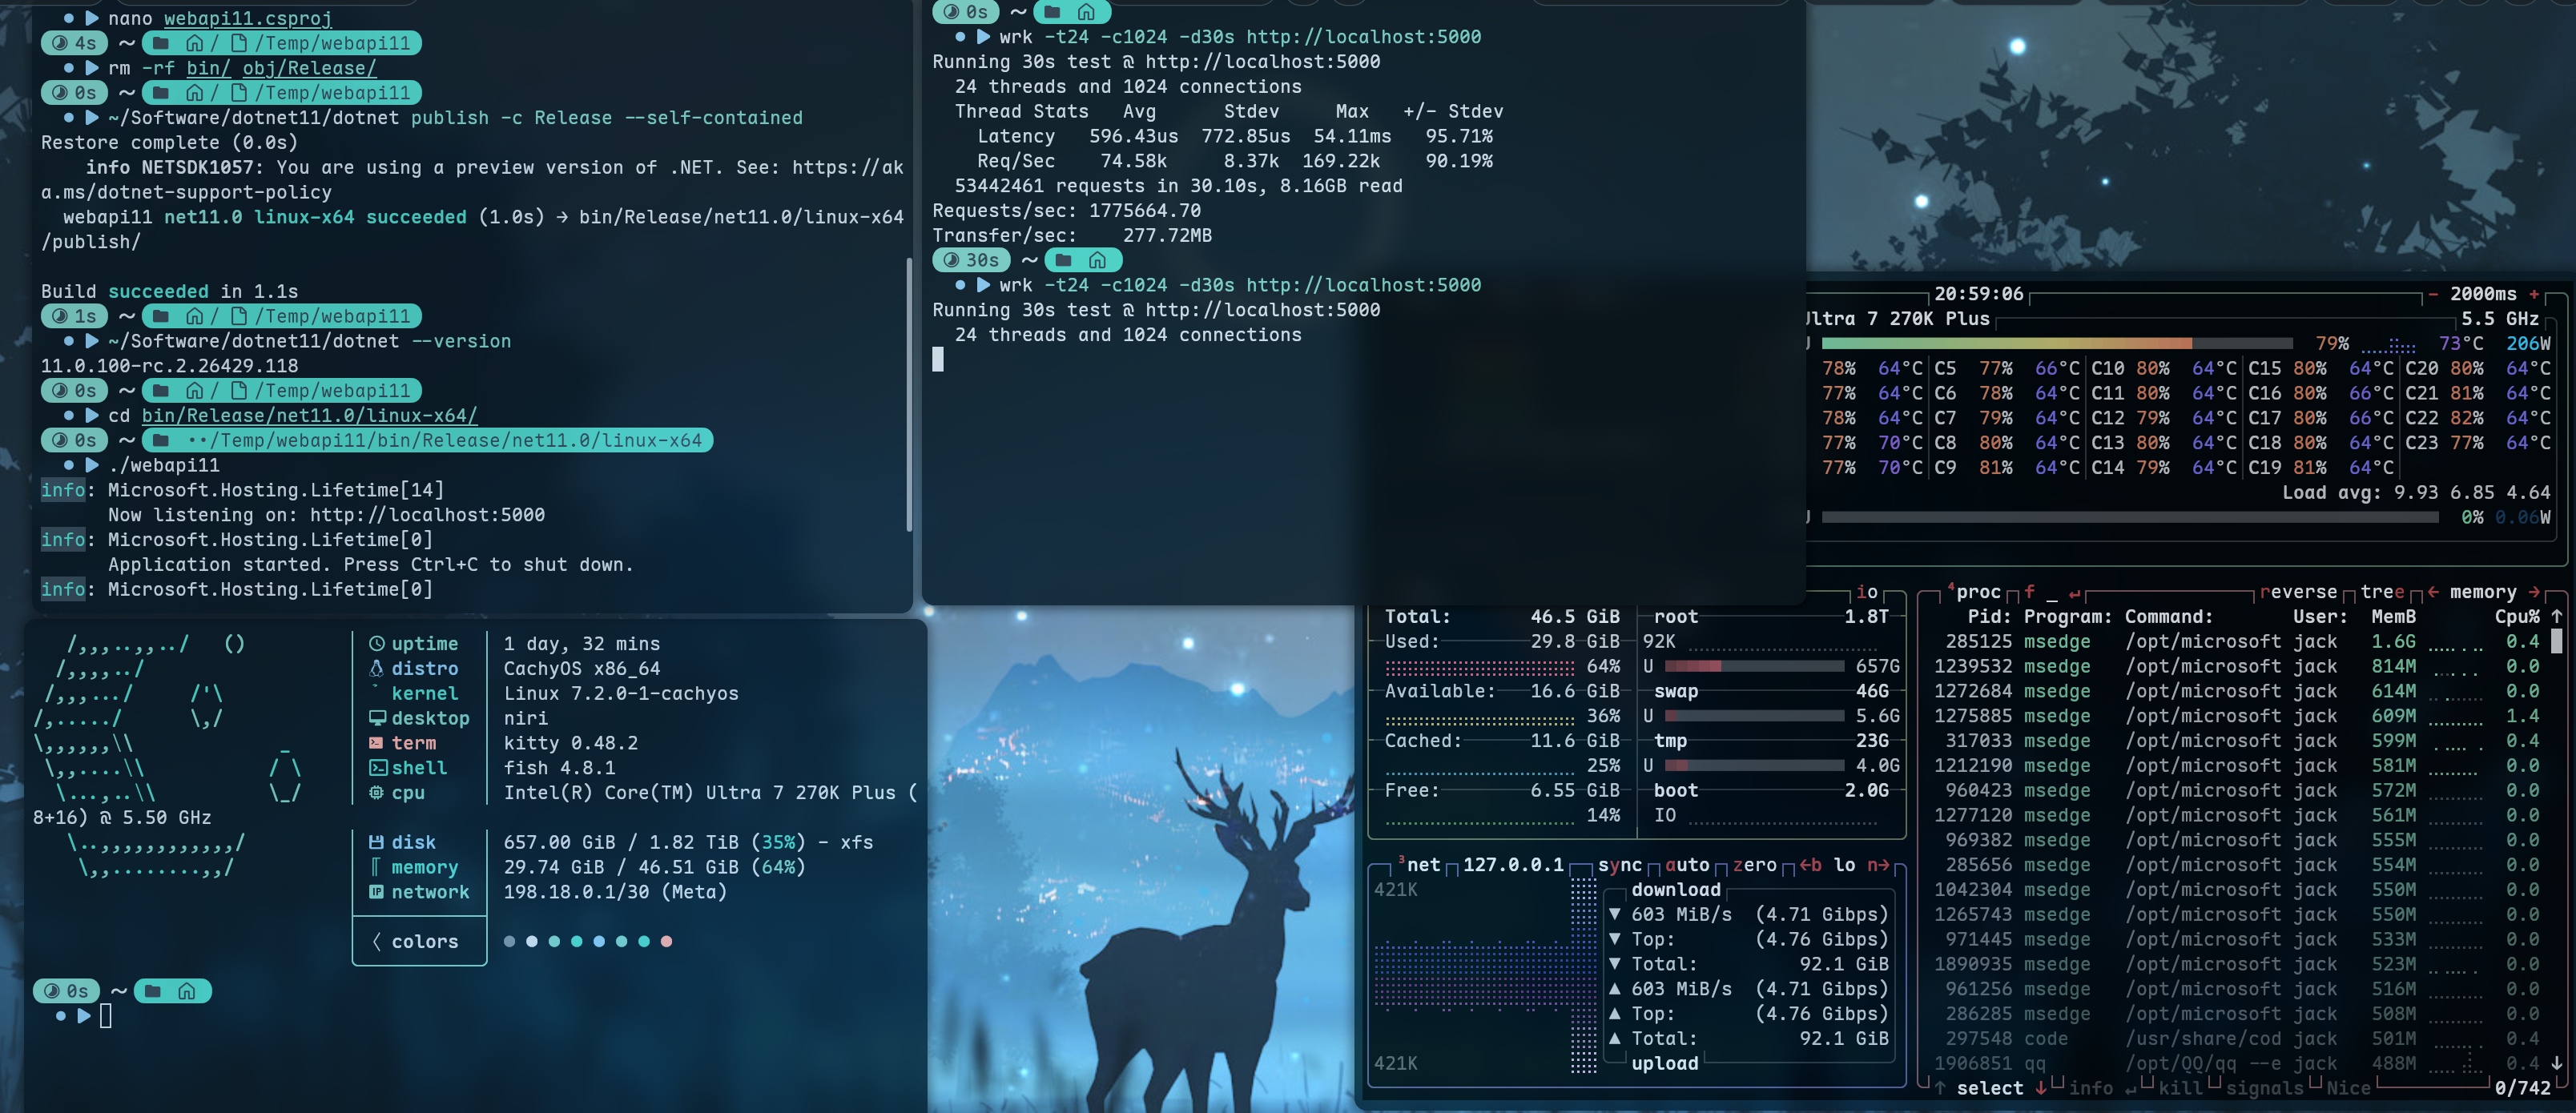
A default ASP.NET Core Minimal API consistently leaves about **19-21% of the whole host CPU idle** during a high-concurrency local HTTP/1.1 plaintext load on a 24-CPU Linux machine. Throughput stabilizes around 1.85-1.90 million requests/second with `wrk -t24 -c1024`, while `mpstat` continues to report approximately five CPUs' worth of idle capacity.
I first suspected a recent .NET or Linux-kernel regression. However, a controlled rebuild of the same source with ASP.NET Core 8.0.30 on the same machine and kernel also reproduced the behavior. The evidence therefore does **not** establish a .NET 10/11 regression. I have observed it manually with .NET 10.0.10 and .NET 11 RC2, and reproduced it with both `wrk` and `oha`.
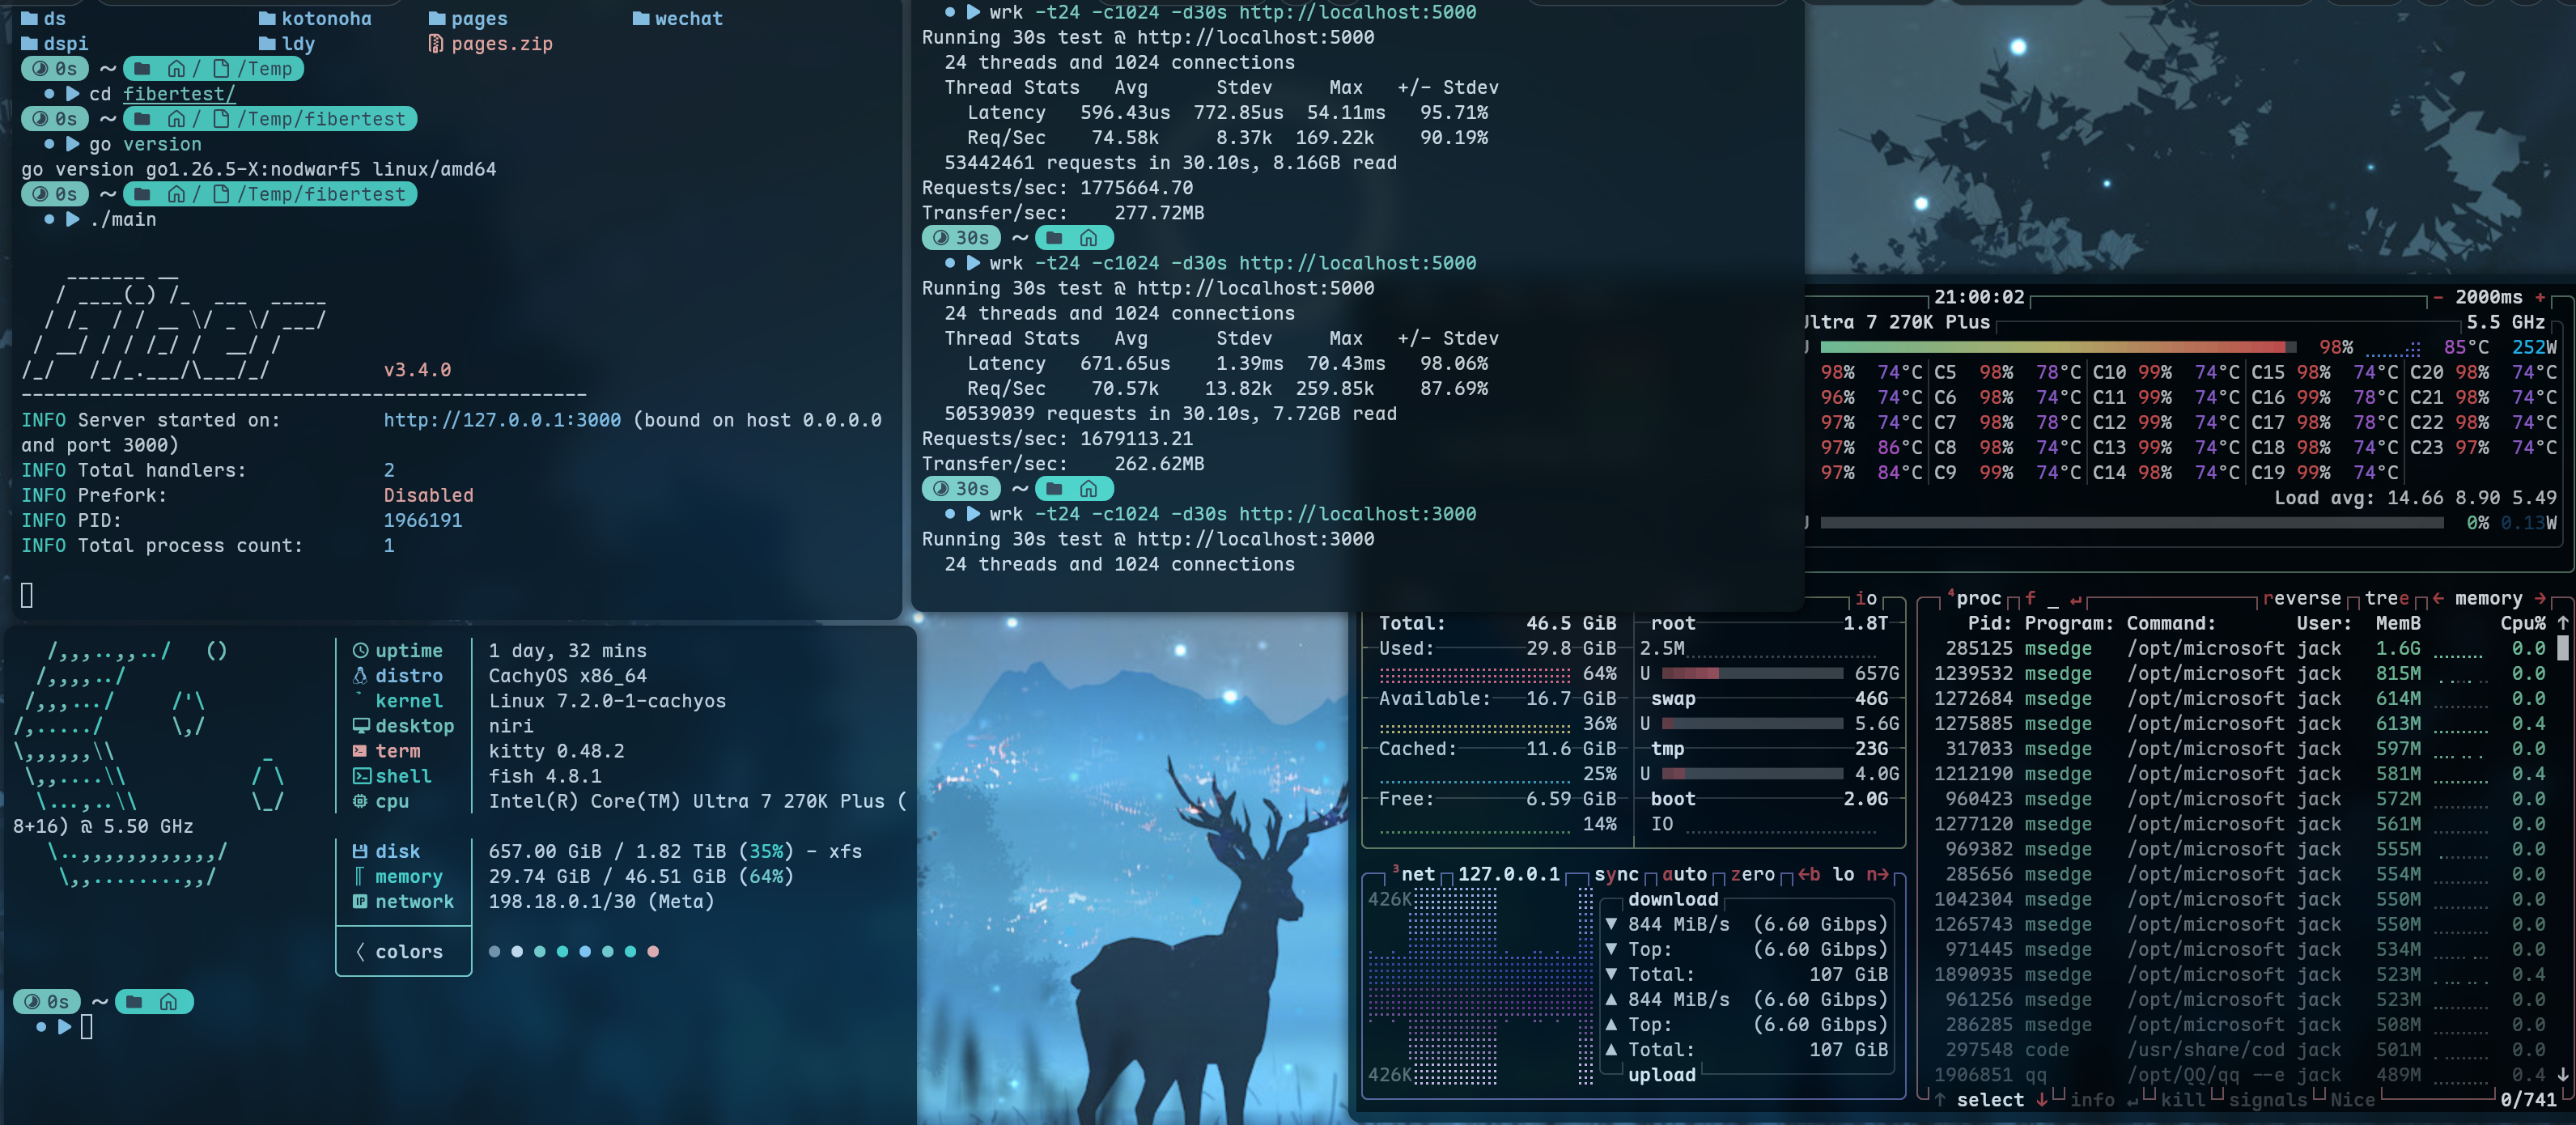
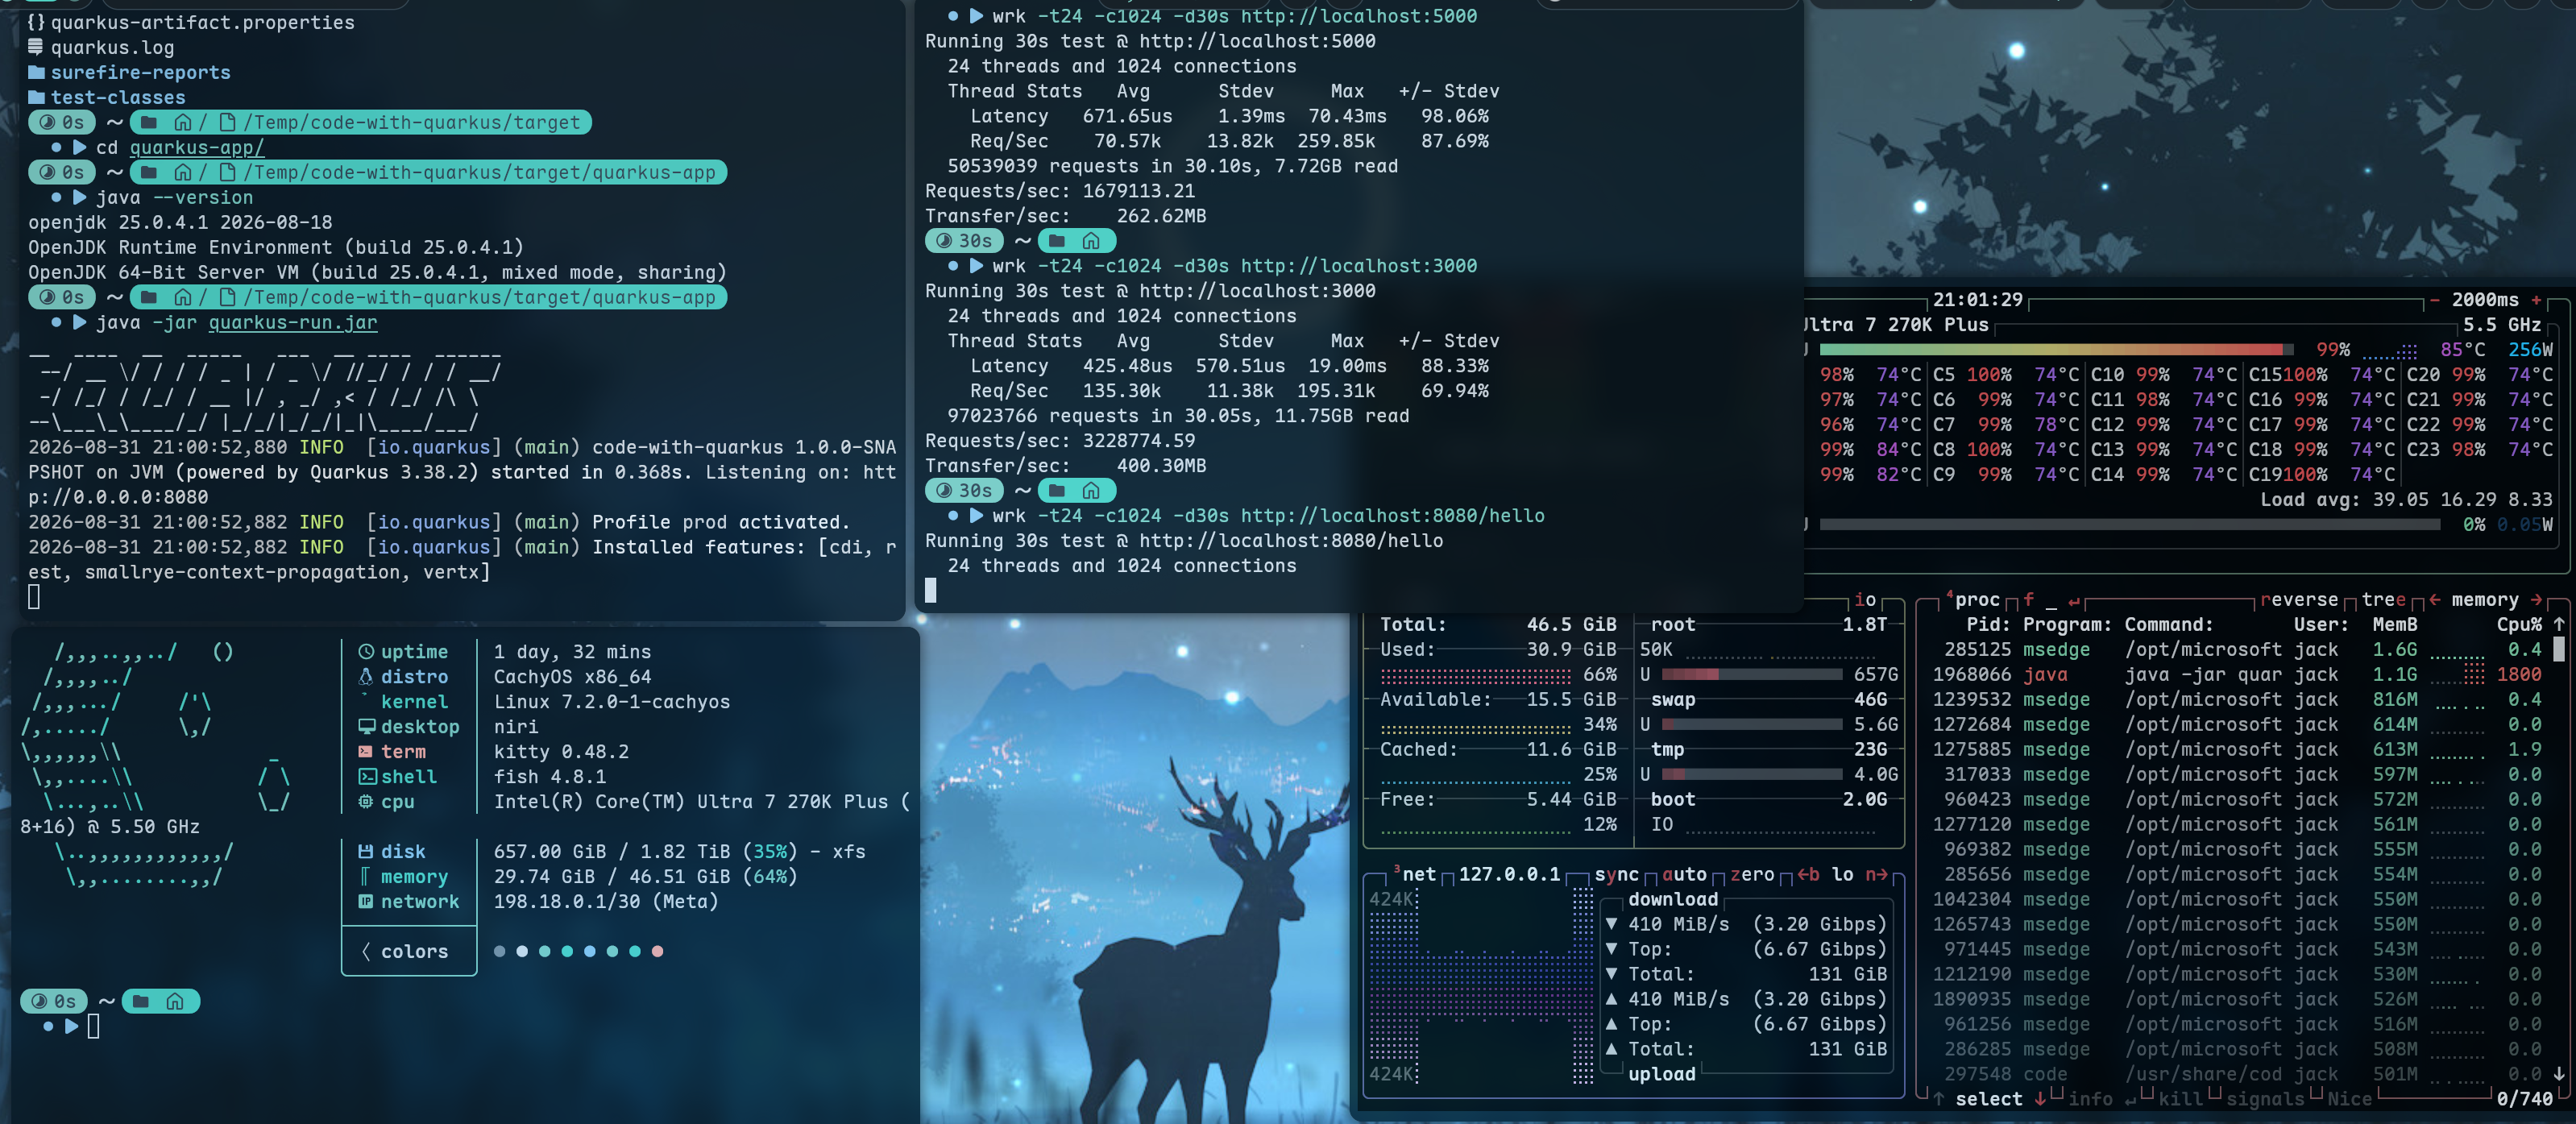
For a control, Go Fiber and Quarkus processes tested with the same `wrk` parameters on the same host reached about 97-99% whole-host CPU utilization. These controls are included only to show that the kernel, scheduler, and local load generator can saturate this host; their response bodies, headers, and implementations differ, so this is not intended as a framework ranking.
Public minimal repro, raw `wrk`/`pidstat`/`mpstat` output, environment details, and screenshots:
https://github.com/mysteriousmy/kestrel-linux-cpu-repro
### Expected Behavior
Under a sustained load with 1,024 concurrent connections and demonstrated load-generator headroom, I expected Kestrel either:
1. to scale closer to whole-host CPU saturation as load increases, with corresponding throughput growth; or
2. to have a documented configuration that can use the remaining capacity and improve throughput.
If the idle capacity is an intentional consequence of Kestrel's scheduling/transport tradeoffs and the current throughput is considered optimal, guidance documenting the expected behavior on high-core-count or hybrid x64 CPUs would also be useful.
### Steps To Reproduce
The repro application is intentionally only one endpoint:
```csharp
var builder = WebApplication.CreateBuilder(args);
var app = builder.Build();
app.MapGet("/", () => "hello world!");
app.Run();
```
1. Clone the public repro:
```bash
git clone https://github.com/mysteriousmy/kestrel-linux-cpu-repro.git
cd kestrel-linux-cpu-repro
```
2. Publish with the .NET 11 RC2/nightly SDK:
```bash
dotnet publish src/KestrelCpuRepro/KestrelCpuRepro.csproj \
-c Release --self-contained -r linux-x64 \
-o artifacts/publish \
--configfile NuGet.Config
```
3. Start the server:
```bash
ASPNETCORE_URLS=http://localhost:5000 \
DOTNET_ENVIRONMENT=Production \
./artifacts/publish/KestrelCpuRepro
```
4. In another terminal, run the included script with the server PID. It raises only the load generator's soft `nofile` limit, performs a 20-second warm-up, then records a 30-second run:
```bash
scripts/benchmark.sh http://localhost:5000/
```
The measured command is:
```bash
wrk --latency -t24 -c1024 -d30s http://localhost:5000/
```
#### .NET 11 RC2 results (three runs of the original default app)
| Run | Requests/sec | Average latency | Kestrel CPU (`pidstat`) | wrk CPU (`pidstat`) | Whole-host busy (`mpstat`) | Whole-host idle |
|---:|---:|---:|---:|---:|---:|---:|
| 1 | 1,896,732.88 | 536.58 us | 1,067.23% | 396.13% | 80.44% | 19.56% |
| 2 | 1,896,001.27 | 534.36 us | 1,052.60% | 396.87% | 80.25% | 19.75% |
| 3 | 1,851,142.27 | 547.52 us | 1,045.05% | 386.34% | 79.48% | 20.52% |
| Median | **1,896,001.27** | **536.58 us** | **1,052.60%** | **396.13%** | **80.25%** | **19.75%** |
`pidstat` uses 100% per logical CPU, so 1,052.60% corresponds to about 10.5 of the machine's 24 CPUs. Linux softirq processing is not fully charged to either user process, which is why the process values do not sum to the whole-host busy percentage.
The reduced minimal endpoint in the public repro produced **1,849,015.25 RPS** and still left **18.98% idle**, so the template's HTTPS redirection middleware and sample weather endpoint are not required to reproduce the behavior.
#### Same-host .NET 8 baseline
The identical source rebuilt with SDK 8.0.424 / ASP.NET Core 8.0.30 produced **1,844,115.41 RPS** and left **21.84% idle**. This rules out calling the report a .NET 10/11 regression based on the currently collected data.
#### Independent client and control checks
- With `oha 1.15.0 --ipv4 -c 1024 -z 30s`, every completed response was HTTP 200 and the host still had **20.23% idle**. As expected for a duration-limited `oha` run without `--wait-ongoing-requests-after-deadline`, 941 in-flight requests were aborted at the deadline.
- Go 1.26.5 / Fiber 3.4.0: **3,336,250.77 RPS**, **97.23% whole-host busy**.
- OpenJDK 25.0.4.1 / Quarkus 3.38.2: **1,950,880.99 RPS**, **98.61% whole-host busy**.
Again, the control-server RPS values are not directly comparable; their purpose is to demonstrate that the same host and load generator can consume the otherwise-idle CPU.
#### Configuration probes
I also tested two isolated .NET 11 processes:
| Change | Requests/sec | Kestrel CPU | Whole-host idle | Result |
|---|---:|---:|---:|---|
| `SocketTransportOptions.IOQueueCount = Environment.ProcessorCount` (24 instead of the default 16) | 1,830,795.65 | 1,055.28% | 20.89% | No improvement |
| `DOTNET_SYSTEM_NET_SOCKETS_THREAD_COUNT=2` | 1,897,544.03 | 1,153.47% | 16.60% | More CPU consumed, but no throughput improvement |
This suggests that simply raising either count is not an effective workaround.
### Exceptions (if any)
None. All recorded `wrk` runs completed without socket errors after raising the load generator's soft `nofile` limit.
### .NET Version
```text
11.0.100-rc.2.26429.118
```
### Anything else?
Relevant environment summary:
```text
OS: CachyOS (Arch Linux family, rolling)
Kernel: Linux 7.2.0-1-cachyos x86_64, SMP PREEMPT_DYNAMIC
glibc: 2.44
CPU: Intel Core Ultra 7 270K Plus
Topology: 1 socket, 24 physical/logical CPUs, 1 thread per core, 1 NUMA node
CPU layout: CPUs 0-7 max 5.5 GHz; CPUs 8-23 max 5.0 GHz
Affinity: CPUs 0-23 for all tested processes; no isolated/nohz_full CPUs
CPU driver/governor: intel_pstate active / powersave (HWP reached boost frequencies)
Memory: 46 GiB
wrk: 4.2.0
oha: 1.15.0
```
```text
.NET SDK:
Version: 11.0.100-rc.2.26429.118
Commit: afc1505248
Workload version: 11.0.100-manifests.d999af15
MSBuild version: 18.12.0-1.26429.118+afc150524
Runtime Environment:
OS Name: cachyos
OS Platform: Linux
RID: linux-x64
Host:
Version: 11.0.0-rc.2.26429.118
Architecture: x64
Commit: afc1505248
.NET runtimes installed:
Microsoft.AspNetCore.App 11.0.0-rc.2.26429.118
Microsoft.NETCore.App 11.0.0-rc.2.26429.118
```
The server and load generator both had `SCHED_OTHER`, nice `-4`, and unrestricted CPU affinity. The same scheduling conditions were used for the controls. Full raw results and additional environment details are in the repro repository.
Related implementation/history:
- dotnet/runtime#36447 discusses idle CPU and scaling on much larger/NUMA machines.
- dotnet/aspnetcore#41391 tracks Kestrel `IOQueue` scheduling tradeoffs.
- dotnet/aspnetcore#56501 increased the default I/O queue count for machines above 32 processors, while noting plaintext regressions with higher counts.
Manual screenshots (.NET 10, .NET 11 RC2, Fiber, and Quarkus)
#### .NET 10
#### .NET 11 RC2
#### Go Fiber control
#### Quarkus control
I can collect an EventPipe trace, `perf` profile, or a `crank` run if the maintainers advise which artifact would be most useful for this case.
Contributor guide
Research direction
Start with the public kestrel-linux-cpu-repro repository and run scripts/benchmark.sh using the documented wrk command to reproduce the idle CPU. Read the related IOQueue scheduling investigations in dotnet/runtime#36447 and dotnet/aspnetcore#41391, then collect the EventPipe, perf, or crank artifact maintainers request. Done means identifying an actionable cause and fix, configuration guidance, or documented expected behavior.
Written by the indexing model from the issue text.
Assessment
- Tech stack
- csharp, linux
- Domain
- backend, networking, performance
- Issue type
- Bug
- Difficulty
- 4/5
- Estimated time
- 3-5 days
- Activity status
- Active
- Clarity
- Needs clarification
- Newbie friendliness
- 38/100