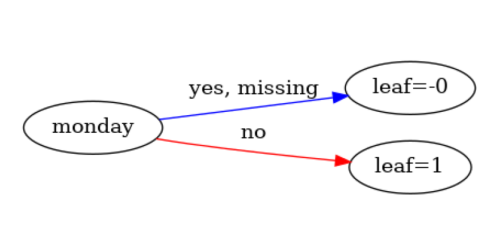
plot_tree labels are reversed
- Dominant language
- C++
- Stars
- 28.8k
- Forks
- 8.9k
- Avg merge
- 1d 12h
- Merged PRs (30d)
- 54
Description
I believe the `plot_tree` function is reversing labels when displayed.
Here is my environment :
```
Python 3.9.5
xgboost==1.6.1
pandas==1.2.1
matplotlib==3.5.2
```
Below is a small script to show the reversed labels.
The script is building a simple model to predict the boolean : "Is is monday ?" and end up with a perfect model but the graph is reversed.
From the script, we've got :
| | day | is it monday ? | predictions |
|---:|:------|-----------------:|--------------:|
| 0 | 0:1 | 1 | 1 |
| 1 | 0:1 | 1 | 1 |
| 2 | 0:1 | 1 | 1 |
| 3 | 1:1 | 0 | 0 |
| 4 | 2:1 | 0 | 0 |
| 5 | 3:1 | 0 | 0 |
| 6 | 4:1 | 0 | 0 |
And the reversed graph :
```
## For the script to work, please create these 3 files in the same folder than the code
# train.txt
# 1 0:1
# 1 0:1
# 1 0:1
# 0 1:1
# 0 2:1
# 0 3:1
# 0 4:1
# test.txt
# -> same as train.txt
# mapping.txt
# 0 monday i
# 1 tuesday i
# 2 wednesday i
# 3 thursday i
# 4 friday i
import xgboost
import pandas as pd
import matplotlib.pyplot as plt
# Train a simple tree
train_dataset = xgboost.DMatrix("train.txt")
test_dataset = xgboost.DMatrix("test.txt")
params = {
"eta": 1,
"objective": "reg:squarederror",
"lambda": 0.0,
"base_score": 0.0,
"nthread": 1,
}
num_tree = 1
model = xgboost.train(params, train_dataset, num_tree, evals=[(test_dataset, "test")])
# The tree is doing perfectly well
print("\nDataset + predictions")
print("---------------------")
df = pd.read_csv("test.txt", sep=" ", names=["is it monday ?", "day"])
df["predictions"] = model.predict(test_dataset)
print(df[["day", "is it monday ?", "predictions"]])
# The dump is consistent too
mapping = "mapping.txt"
model.dump_model("my_model_dump", mapping)
print("\nMy model to text")
print("-----------------")
with open("my_model_dump", "r") as my_model_file:
for line in my_model_file:
print(line)
# However the plot_tree is reversed
fig, ax = plt.subplots(figsize=(8, 6))
ax = xgboost.plot_tree(model, rankdir="LR", num_trees=0, ax=ax, fmap=mapping)
plt.show()
```
Contributor guide
No contributing guide indexed for this repository
Assessment
This issue has not been assessed yet.