What does the parameter "thin" mean?
Nobody has claimed this yet.
- Dominant language
- Python
- Stars
- 1.6k
- Forks
- 440
- PR merge metrics
- No merged PRs in 30d
Description
General information:
- emcee version: 3.0.2
- platform: Ubuntu
- installation method (pip/conda/source/other?): pip
Problem description:
I'm wondering what does the parameter 'thin' exactly mean? I find for different thin value, the result is different.
So I'm confused what value should I set to the parameter 'thin': flat_samples = sampler.get_chain(discard=100, thin=?, flat=True) ?
let steps= 5000, walks=32, discard=100, and let
flat_samples = sampler.get_chain(discard=100, flat=True, thin=i)
If I denote the size of flat_samples when thin= i as ' flat_samples| thin= i ', I found:
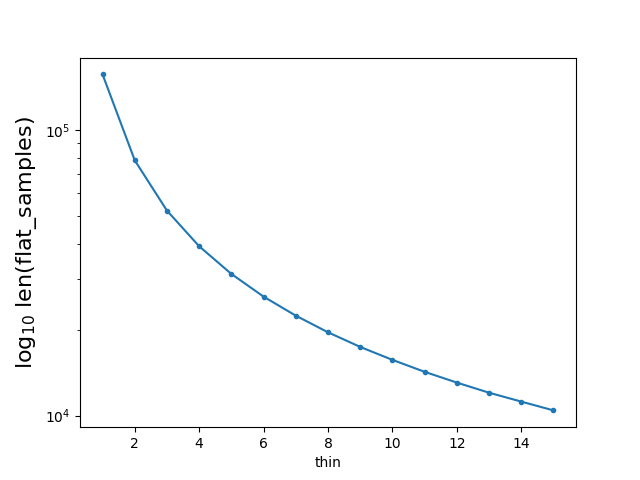
flat_samples | thin=1 = (5000-100)*32 =156800
flat_samples | thin=i = [ (5000-100)/thin] * 32
But I still do not understand the meaning of the parameter 'thin'.
Why should one 'thin' a relatively big sample to a small sample?
Code to show my question:
import numpy as np
import matplotlib.pyplot as plt

np.random.seed(123)

# Choose the "true" parameters.
m_true = -0.9594
b_true = 4.294
f_true = 0.534

# Generate some synthetic data from the model.
N = 50
x = np.sort(10 * np.random.rand(N))
yerr = 0.1 + 0.5 * np.random.rand(N)
y = m_true * x + b_true
y += np.abs(f_true * y) * np.random.randn(N)
y += yerr * np.random.randn(N)

def log_likelihood(theta, x, y, yerr):
    m, b, log_f = theta
    model = m * x + b
    sigma2 = yerr ** 2 + model ** 2 * np.exp(2 * log_f)
    return -0.5 * np.sum((y - model) ** 2 / sigma2 + np.log(sigma2))

def log_prior(theta):
    m, b, log_f = theta
    if -5.0 < m < 0.5 and 0.0 < b < 10.0 and -10.0 < log_f < 1.0:
        return 0.0
    return -np.inf

def log_probability(theta, x, y, yerr):
    lp = log_prior(theta)
    if not np.isfinite(lp):
        return -np.inf
    return lp + log_likelihood(theta, x, y, yerr)

x0=np.array([-1.00300851,  4.52831429, -0.79044033])

import emcee

pos = x0 + 1e-4 * np.random.randn(32, 3)
nwalkers, ndim = pos.shape

sampler = emcee.EnsembleSampler(nwalkers, ndim, log_probability, args=(x, y, yerr))
sampler.run_mcmc(pos, 5000, progress=True);

flat_samples = sampler.get_chain(discard=100, thin=15, flat=True)
print(flat_samples.shape)

x=np.zeros(15)
y=np.zeros(15)
for i in range(1,16):
    flat_samples = sampler.get_chain(discard=100, flat=True, thin=i)
    x[i-1]=i
    y[i-1]=len(flat_samples)

fig, ax = plt.subplots()
ax.semilogy(x, y,'.-')
plt.xlabel("thin")
plt.ylabel(r"$\log_{10}$ len(flat_samples)",fontsize=16);
plt.savefig("thin.png")
plt.show()
# sample code goes here...
By running the above code, I got a figure showing the relation between the value of thin and len(flat_samples):
Then I made a corner plot by setting thin=1
flat_samples = sampler.get_chain(discard=100, thin=1, flat=True)
import corner
labels = ["m", "b", "log(f)"]
fig = corner.corner(
    flat_samples, labels=labels, truths=[m_true, b_true, np.log(f_true)]
);

I made another corner plot by setting thin=15, I found the figure is different:
flat_samples = sampler.get_chain(discard=100, thin=15, flat=True)
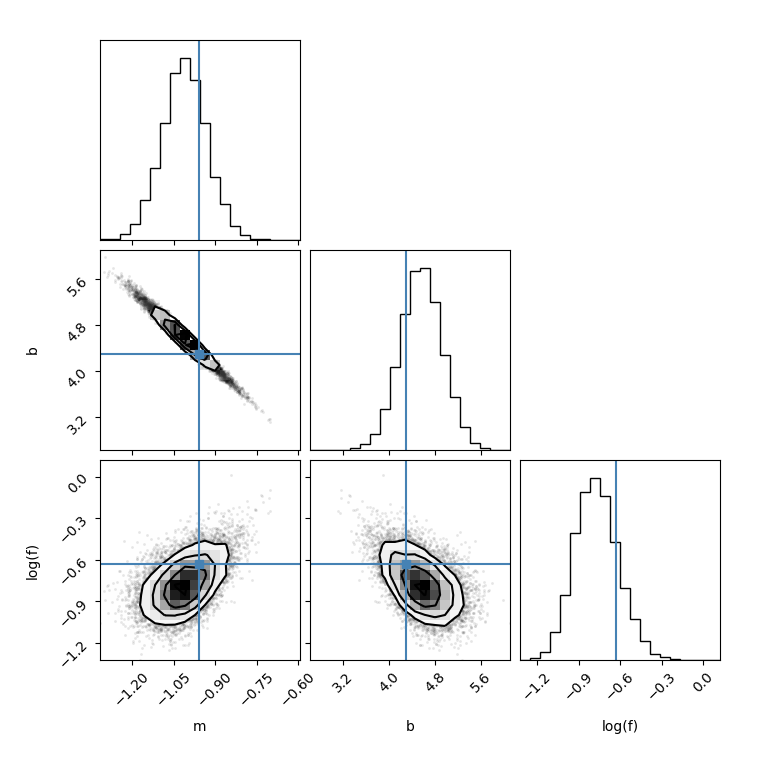
Then I run the following code, I found for different thin value, the results is also different.
from IPython.display import display, Math
for i in range(ndim):
    mcmc = np.percentile(flat_samples[:, i], [16, 50, 84])
    q = np.diff(mcmc)
    txt = "\mathrm{{{3}}} = {0:.3f}_{{-{1:.3f}}}^{{{2:.3f}}}"
    txt = txt.format(mcmc[1], q[0], q[1], labels[i])
    display(Math(txt))
Contributor guide
First steps
- Read the whole issue, then the project's contributing guide.
- Comment on the issue to say you are picking it up — it saves two people doing the same work.
- Fork the repository and make your change on a branch.
- Open a pull request that references the issue number.
Research direction
Start with the sampler.get_chain(discard=100, thin=..., flat=True) entry point and the emcee 3.0.2 documentation for chain retrieval. Clarify what thin changes, why it changes the sample count, and how it relates to the differing corner plots and percentile results shown in the example.
Written by the indexing model from the issue text.
Assessment
- Tech stack
- python
- Domain
- documentation
- Issue type
- Documentation
- Difficulty
- 2/5
- Estimated time
- 1-3 hours
- Activity status
- Stale
- Clarity
- Needs clarification
- Newbie friendliness
- 35/100